Modelagem da dinâmica de uma paisagem do Planalto de Ibiúna ...
Modelagem da dinâmica de uma paisagem do Planalto de Ibiúna ...
Modelagem da dinâmica de uma paisagem do Planalto de Ibiúna ...

You also want an ePaper? Increase the reach of your titles
YUMPU automatically turns print PDFs into web optimized ePapers that Google loves.
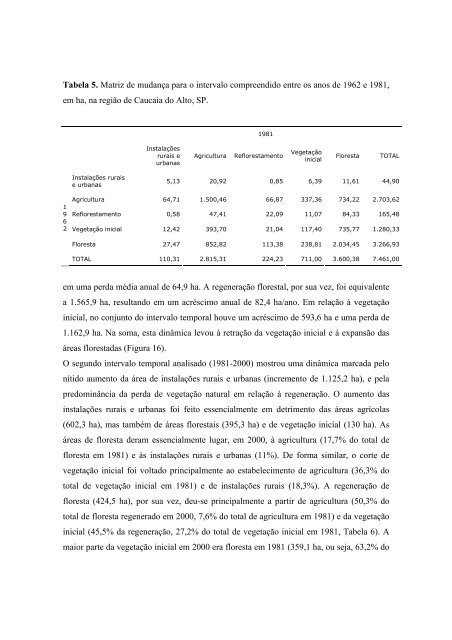
Tabela 5. Matriz <strong>de</strong> mu<strong>da</strong>nça para o intervalo compreendi<strong>do</strong> entre os anos <strong>de</strong> 1962 e 1981,<br />
em ha, na região <strong>de</strong> Caucaia <strong>do</strong> Alto, SP.<br />
1<br />
9<br />
6<br />
2<br />
Instalações rurais<br />
e urbanas<br />
Instalações<br />
rurais e<br />
urbanas<br />
em <strong>uma</strong> per<strong>da</strong> média anual <strong>de</strong> 64,9 ha. A regeneração florestal, por sua vez, foi equivalente<br />
a 1.565,9 ha, resultan<strong>do</strong> em um acréscimo anual <strong>de</strong> 82,4 ha/ano. Em relação à vegetação<br />
inicial, no conjunto <strong>do</strong> intervalo temporal houve um acréscimo <strong>de</strong> 593,6 ha e <strong>uma</strong> per<strong>da</strong> <strong>de</strong><br />
1.162,9 ha. Na soma, esta <strong>dinâmica</strong> levou à retração <strong>da</strong> vegetação inicial e à expansão <strong>da</strong>s<br />
áreas floresta<strong>da</strong>s (Figura 16).<br />
O segun<strong>do</strong> intervalo temporal analisa<strong>do</strong> (1981-2000) mostrou <strong>uma</strong> <strong>dinâmica</strong> marca<strong>da</strong> pelo<br />
níti<strong>do</strong> aumento <strong>da</strong> área <strong>de</strong> instalações rurais e urbanas (incremento <strong>de</strong> 1.125,2 ha), e pela<br />
pre<strong>do</strong>minância <strong>da</strong> per<strong>da</strong> <strong>de</strong> vegetação natural em relação à regeneração. O aumento <strong>da</strong>s<br />
instalações rurais e urbanas foi feito essencialmente em <strong>de</strong>trimento <strong>da</strong>s áreas agrícolas<br />
(602,3 ha), mas também <strong>de</strong> áreas florestais (395,3 ha) e <strong>de</strong> vegetação inicial (130 ha). As<br />
áreas <strong>de</strong> floresta <strong>de</strong>ram essencialmente lugar, em 2000, à agricultura (17,7% <strong>do</strong> total <strong>de</strong><br />
floresta em 1981) e às instalações rurais e urbanas (11%). De forma similar, o corte <strong>de</strong><br />
vegetação inicial foi volta<strong>do</strong> principalmente ao estabelecimento <strong>de</strong> agricultura (36,3% <strong>do</strong><br />
total <strong>de</strong> vegetação inicial em 1981) e <strong>de</strong> instalações rurais (18,3%). A regeneração <strong>de</strong><br />
floresta (424,5 ha), por sua vez, <strong>de</strong>u-se principalmente a partir <strong>de</strong> agricultura (50,3% <strong>do</strong><br />
total <strong>de</strong> floresta regenera<strong>do</strong> em 2000, 7,6% <strong>do</strong> total <strong>de</strong> agricultura em 1981) e <strong>da</strong> vegetação<br />
inicial (45,5% <strong>da</strong> regeneração, 27,2% <strong>do</strong> total <strong>de</strong> vegetação inicial em 1981, Tabela 6). A<br />
maior parte <strong>da</strong> vegetação inicial em 2000 era floresta em 1981 (359,1 ha, ou seja, 63,2% <strong>do</strong><br />
1981<br />
Agricultura Reflorestamento Vegetação<br />
inicial<br />
Floresta TOTAL<br />
5,13 20,92 0,85 6,39 11,61 44,90<br />
Agricultura 64,71 1.500,46 66,87 337,36 734,22 2.703,62<br />
Reflorestamento 0,58 47,41 22,09 11,07 84,33 165,48<br />
Vegetação inicial 12,42 393,70 21,04 117,40 735,77 1.280,33<br />
Floresta 27,47 852,82 113,38 238,81 2.034,45 3.266,93<br />
TOTAL 110,31 2.815,31 224,23 711,00 3.600,38 7.461,00