Mapa do Mercado de Trabalho no Brasil - IBGE
Mapa do Mercado de Trabalho no Brasil - IBGE
Mapa do Mercado de Trabalho no Brasil - IBGE
Create successful ePaper yourself
Turn your PDF publications into a flip-book with our unique Google optimized e-Paper software.
128 <strong>IBGE</strong> _________________________________________________________ <strong>Mapa</strong> <strong>do</strong> Merca<strong>do</strong> <strong>de</strong> <strong>Trabalho</strong> <strong>no</strong> <strong>Brasil</strong><br />
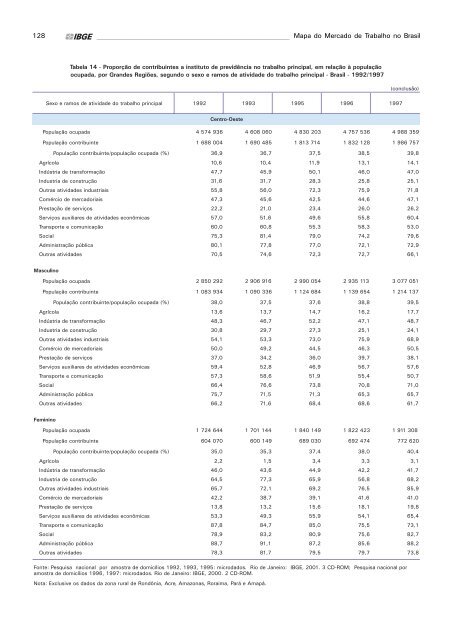
Tabela 14 - Proporção <strong>de</strong> contribuintes a instituto <strong>de</strong> previdência <strong>no</strong> trabalho principal, em relação à população<br />
ocupada, por Gran<strong>de</strong>s Regiões, segun<strong>do</strong> o sexo e ramos <strong>de</strong> ativida<strong>de</strong> <strong>do</strong> trabalho principal - <strong>Brasil</strong> - 1992/1997<br />
(conclusão)<br />
Sexo e ramos <strong>de</strong> ativida<strong>de</strong> <strong>do</strong> trabalho principal 1992 1993 1995 1996 1997<br />
Centro-Oeste<br />
População ocupada 4 574 936 4 608 060 4 830 203 4 757 536 4 988 359<br />
População contribuinte 1 688 004 1 690 485 1 813 714 1 832 128 1 986 757<br />
População contribuinte/população ocupada (%) 36,9 36,7 37,5 38,5 39,8<br />
Agrícola 10,6 10,4 11,9 13,1 14,1<br />
Indústria <strong>de</strong> transformação 47,7 45,9 50,1 46,0 47,0<br />
Industria <strong>de</strong> construção 31,6 31,7 28,3 25,8 25,1<br />
Outras ativida<strong>de</strong>s industriais 55,8 56,0 72,3 75,9 71,8<br />
Comércio <strong>de</strong> merca<strong>do</strong>riais 47,3 45,6 42,5 44,6 47,1<br />
Prestação <strong>de</strong> serviços 22,2 21,0 23,4 26,0 26,2<br />
Serviços auxiliares <strong>de</strong> ativida<strong>de</strong>s econômicas 57,0 51,6 49,6 55,8 60,4<br />
Transporte e comunicação 60,0 60,8 55,3 58,3 53,0<br />
Social 75,3 81,4 79,0 74,2 79,6<br />
Administração pública 80,1 77,8 77,0 72,1 72,9<br />
Outras ativida<strong>de</strong>s 70,5 74,6 72,3 72,7 66,1<br />
Masculi<strong>no</strong><br />
População ocupada 2 850 292 2 906 916 2 990 054 2 935 113 3 077 051<br />
População contribuinte 1 083 934 1 090 336 1 124 684 1 139 654 1 214 137<br />
População contribuinte/população ocupada (%) 38,0 37,5 37,6 38,8 39,5<br />
Agrícola 13,6 13,7 14,7 16,2 17,7<br />
Indústria <strong>de</strong> transformação 48,3 46,7 52,2 47,1 48,7<br />
Industria <strong>de</strong> construção 30,8 29,7 27,3 25,1 24,1<br />
Outras ativida<strong>de</strong>s industriais 54,1 53,3 73,0 75,9 68,9<br />
Comércio <strong>de</strong> merca<strong>do</strong>riais 50,0 49,2 44,5 46,3 50,5<br />
Prestação <strong>de</strong> serviços 37,0 34,2 36,0 39,7 38,1<br />
Serviços auxiliares <strong>de</strong> ativida<strong>de</strong>s econômicas 59,4 52,8 46,9 56,7 57,6<br />
Transporte e comunicação 57,3 58,6 51,9 55,4 50,7<br />
Social 66,4 76,6 73,8 70,8 71,0<br />
Administração pública 75,7 71,5 71,3 65,3 65,7<br />
Outras ativida<strong>de</strong>s 66,2 71,6 68,4 68,6 61,7<br />
Femini<strong>no</strong><br />
População ocupada 1 724 644 1 701 144 1 840 149 1 822 423 1 911 308<br />
População contribuinte 604 070 600 149 689 030 692 474 772 620<br />
População contribuinte/população ocupada (%) 35,0 35,3 37,4 38,0 40,4<br />
Agrícola 2,2 1,5 3,4 3,3 3,1<br />
Indústria <strong>de</strong> transformação 46,0 43,6 44,9 42,2 41,7<br />
Industria <strong>de</strong> construção 64,5 77,3 65,9 56,8 68,2<br />
Outras ativida<strong>de</strong>s industriais 65,7 72,1 69,2 76,5 85,9<br />
Comércio <strong>de</strong> merca<strong>do</strong>riais 42,2 38,7 39,1 41,6 41,0<br />
Prestação <strong>de</strong> serviços 13,8 13,2 15,6 18,1 19,8<br />
Serviços auxiliares <strong>de</strong> ativida<strong>de</strong>s econômicas 53,3 49,3 55,9 54,1 65,4<br />
Transporte e comunicação 87,8 84,7 85,0 75,5 73,1<br />
Social 78,9 83,2 80,9 75,6 82,7<br />
Administração pública 88,7 91,1 87,2 85,6 88,2<br />
Outras ativida<strong>de</strong>s 78,3 81,7 79,5 79,7 73,8<br />
Fonte: Pesquisa nacional por amostra <strong>de</strong> <strong>do</strong>micílios 1992, 1993, 1995: microda<strong>do</strong>s. Rio <strong>de</strong> Janeiro: <strong>IBGE</strong>, 2001. 3 CD-ROM; Pesquisa nacional por<br />
amostra <strong>de</strong> <strong>do</strong>micílios 1996, 1997: microda<strong>do</strong>s. Rio <strong>de</strong> Janeiro: <strong>IBGE</strong>, 2000. 2 CD-ROM.<br />
Nota: Exclusive os da<strong>do</strong>s da zona rural <strong>de</strong> Rondônia, Acre, Amazonas, Roraima, Pará e Amapá.


