A2.6.2 Tabellen zur Abstandsbest<strong>im</strong>mung Tabelle zur Abbildung 3.3.8 Spalten: Nummer des Bunttones, Zeilen: Nummer der <strong>Sättigung</strong>slinien 1 3 5 7 9 11 13 15 17 19 21 23 1 16 15,5 15 12 12 13 18,5 25 22 11 7 9,5 2 15 17 15 16 14 9,5 13 19 18 10 6,5 10 3 10 15 18 17 14,5 8 12 14 12,5 9 7 10 4 10 15 18 18 11 6,5 9 10 10 10 7,5 8 5 9 9,5 12,5 14,5 9 7 9 9 8 8 8,5 8 6 7 8 12 11,5 8 6 7 6 7,5 8 7,5 7 7 7,5 8 8,5 15 6 4 5 5 7 6 6,5 8 8 6 7,5 10 11,5 6 4 5 5 8 5 5 6,5 80,5 95,5 109 115,5 80,5 58 78,5 93 93 67 55,5 67 1 1,6 1,3 1,1 0,8 1,2 1,8 1,9 2,2 1,9 1,3 1,0 1,1 2 1,5 1,4 1,1 1,1 1,4 1,3 1,3 1,6 1,5 1,2 0,9 1,2 3 1,0 1,3 1,3 1,2 1,4 1,1 1,2 1,2 1,1 1,1 1,0 1,2 4 1,0 1,3 1,3 1,2 1,1 0,9 0,9 0,9 0,9 1,2 1,1 1,0 5 0,9 0,8 0,9 1,0 0,9 1,0 0,9 0,8 0,7 1,0 1,2 1,0 6 0,7 0,7 0,9 0,8 0,8 0,8 0,7 0,5 0,6 1,0 1,1 0,8 7 0,7 0,7 0,6 1,0 0,6 0,6 0,5 0,4 0,6 0,7 0,9 1,0 8 0,6 0,6 0,7 0,8 0,6 0,6 0,5 0,4 0,7 0,6 0,7 0,8 1 1,6 1,3 1,1 0,8 1,2 1,8 1,9 2,2 1,9 1,3 1,0 1,1 2 3,1 2,7 2,2 1,9 2,6 3,1 3,2 3,8 3,4 2,5 1,9 2,3 3 4,1 4,0 3,5 3,1 4,0 4,2 4,4 5,0 4,5 3,6 3,0 3,5 4 5,1 5,2 4,8 4,4 5,1 5,1 5,4 5,8 5,4 4,8 4,0 4,5 5 6,0 6,0 5,8 5,4 6,0 6,1 6,3 6,6 6,1 5,7 5,3 5,4 6 6,7 6,7 6,6 6,2 6,8 6,9 7,0 7,1 6,7 6,7 6,3 6,3 7 7,4 7,4 7,3 7,2 7,4 7,4 7,5 7,6 7,3 7,4 7,3 7,2 8 8,0 8,0 8,0 8,0 8,0 8,0 8,0 8,0 8,0 8,0 8,0 8,0 Tabelle zur Abbildung 3.3.9 132 1 5 8 11 13 15 19 22 1 7 11 11 9 12,5 15 7 5,5 2 9 12 11,5 8,5 11,5 12,5 7 5,5 3 9 11,5 11 7 9,5 12 7 6 4 10 12,5 11,5 6,5 8 8,5 7,5 7 5 11 13 9 5 8 9 6,5 7,5 6 12 13 9 5 7,5 7,5 6 8 58 73 63 41 57 64,5 41 39,5 1 0,7 0,9 1,0 1,3 1,3 1,4 1,0 0,8 2 0,9 1,0 1,1 1,2 1,2 1,2 1,0 0,8 3 0,9 0,9 1,0 1,0 1,0 1,1 1,0 0,9 4 1,0 1,0 1,1 1,0 0,8 0,8 1,1 1,1 5 1,1 1,1 0,9 0,7 0,8 0,8 1,0 1,1 6 1,2 1,1 0,9 0,7 0,8 0,7 0,9 1,2 1 0,7 0,9 1,0 1,3 1,3 1,4 1,0 0,8 2 1,7 1,9 2,1 2,6 2,5 2,6 2,0 1,7 3 2,6 2,8 3,2 3,6 3,5 3,7 3,1 2,6 4 3,6 3,9 4,3 4,5 4,4 4,5 4,2 3,6 5 4,8 4,9 5,1 5,3 5,2 5,3 5,1 4,8 6 6,0 6,0 6,0 6,0 6,0 6,0 6,0 6,0
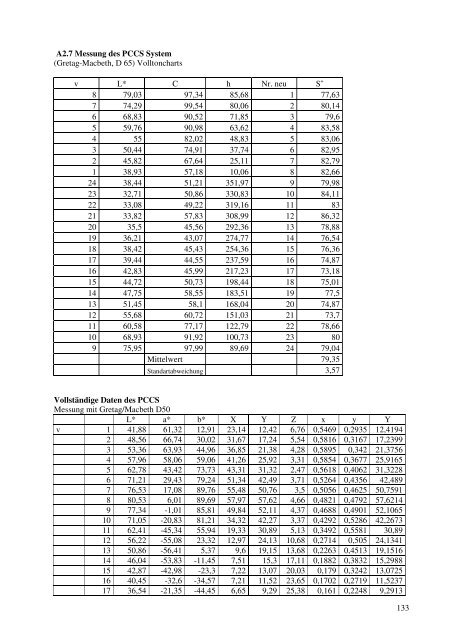
A2.7 Messung des PCCS System (Gretag-Macbeth, D 65) Volltoncharts v L* C h Nr. neu S + 8 79,03 97,34 85,68 1 77,63 7 74,29 99,54 80,06 2 80,14 6 68,83 90,52 71,85 3 79,6 5 59,76 90,98 63,62 4 83,58 4 55 82,02 48,83 5 83,06 3 50,44 74,91 37,74 6 82,95 2 45,82 67,64 25,11 7 82,79 1 38,93 57,18 10,06 8 82,66 24 38,44 51,21 351,97 9 79,98 23 32,71 50,86 330,83 10 84,11 22 33,08 49,22 319,16 11 83 21 33,82 57,83 308,99 12 86,32 20 35,5 45,56 292,36 13 78,88 19 36,21 43,07 274,77 14 76,54 18 38,42 45,43 254,36 15 76,36 17 39,44 44,55 237,59 16 74,87 16 42,83 45,99 217,23 17 73,18 15 44,72 50,73 198,44 18 75,01 14 47,75 58,55 183,51 19 77,5 13 51,45 58,1 168,04 20 74,87 12 55,68 60,72 151,03 21 73,7 11 60,58 77,17 122,79 22 78,66 10 68,93 91,92 100,73 23 80 9 75,95 97,99 89,69 24 79,04 Mittelwert 79,35 Standartabweichung 3,57 Vollständige Daten des PCCS Messung mit Gretag/Macbeth D50 L* a* b* X Y Z x y Y v 1 41,88 61,32 12,91 23,14 12,42 6,76 0,5469 0,2935 12,4194 2 48,56 66,74 30,02 31,67 17,24 5,54 0,5816 0,3167 17,2399 3 53,36 63,93 44,96 36,85 21,38 4,28 0,5895 0,342 21,3756 4 57,96 58,06 59,06 41,26 25,92 3,31 0,5854 0,3677 25,9165 5 62,78 43,42 73,73 43,31 31,32 2,47 0,5618 0,4062 31,3228 6 71,21 29,43 79,24 51,34 42,49 3,71 0,5264 0,4356 42,489 7 76,53 17,08 89,76 55,48 50,76 3,5 0,5056 0,4625 50,7591 8 80,53 6,01 89,69 57,97 57,62 4,66 0,4821 0,4792 57,6214 9 77,34 -1,01 85,81 49,84 52,11 4,37 0,4688 0,4901 52,1065 10 71,05 -20,83 81,21 34,32 42,27 3,37 0,4292 0,5286 42,2673 11 62,41 -45,34 55,94 19,33 30,89 5,13 0,3492 0,5581 30,89 12 56,22 -55,08 23,32 12,97 24,13 10,68 0,2714 0,505 24,1341 13 50,86 -56,41 5,37 9,6 19,15 13,68 0,2263 0,4513 19,1516 14 46,04 -53,83 -11,45 7,51 15,3 17,11 0,1882 0,3832 15,2988 15 42,87 -42,98 -23,3 7,22 13,07 20,03 0,179 0,3242 13,0725 16 40,45 -32,6 -34,57 7,21 11,52 23,65 0,1702 0,2719 11,5237 17 36,54 -21,35 -44,45 6,65 9,29 25,38 0,161 0,2248 9,2913 133
- Seite 3 und 4:
Sättigung im CIELAB-Farbsystem und
- Seite 5 und 6:
Kurzfassung Bisher fehlte eine Form
- Seite 7 und 8:
Inhaltsverzeichnis 0 Zielstellung -
- Seite 9 und 10:
0 Zielstellung -Motivation In den l
- Seite 11 und 12:
Abb. 1.1.2 zeigt einen horizontalen
- Seite 13 und 14:
Die Stäbchen sind Sensoren mit gr
- Seite 15 und 16:
Probe + Umfeld Absorption Auge (Ret
- Seite 17 und 18:
L* 100 90 80 70 60 50 40 30 20 10 0
- Seite 19 und 20:
Die Zellen und ihr Verhalten sind a
- Seite 21 und 22:
Unter Buntton (früher Farbton) ver
- Seite 23 und 24:
Die DIN 5033 zur Farbmessung lässt
- Seite 25 und 26:
1.1.4 Ermittelung von Empfindungsgr
- Seite 27 und 28:
Oft erfolgt die Anordnung so, dass
- Seite 29 und 30:
Abb. 1.2.4 Schiefer Doppelkegel, na
- Seite 31 und 32:
sind folgende Gleichungen definiert
- Seite 33 und 34:
F* C*ab L* C Abb. 1.2.11 Farbe F* b
- Seite 35 und 36:
Die folgende Abbildung soll den „
- Seite 37 und 38:
1.3.3 Die Sättigung im CIELUV-Farb
- Seite 39 und 40:
1.3.5 Buntheit und Sättigung im CI
- Seite 41 und 42:
Die hohen Sättigungsstufen, die vo
- Seite 43 und 44:
13 violettblau 17 Cyanblau 20 Smara
- Seite 45 und 46:
Abb. 1.3.11 Umfeldwirkung auch scho
- Seite 47 und 48:
L* Gelb-Violettblaue Ebene C* n Abb
- Seite 49 und 50:
3. Überprüfung der vorgeschlagene
- Seite 51 und 52:
Vergleicht man visuell die beiden b
- Seite 53 und 54:
100,00 90,00 80,00 70,00 60,00 50,0
- Seite 55 und 56:
0,7 0,6 0,5 0,4 0,3 0,2 0,1 Grüne
- Seite 57 und 58:
90 80 70 60 50 40 30 20 10 Sättigu
- Seite 59 und 60:
ausgesprochen gleichmäßigen Verla
- Seite 61 und 62:
Farbscheiben gesorgt; kleine Ausgle
- Seite 63 und 64:
Abb. 3.3.10 Transformation der Mess
- Seite 65 und 66:
Abb. 3.3.12 Reinheitsstufen in der
- Seite 67 und 68:
Dass unterschiedlich viele Sättigu
- Seite 69 und 70:
S Abb. 3.3.18 Berechnete Sättigung
- Seite 71 und 72:
S + 40 35 30 25 S 20 15 10 5 0 T 21
- Seite 73 und 74:
Man erkennt, dass eine Korrektur mi
- Seite 75 und 76:
d 8,0 7,0 6,0 5,0 4,0 3,0 2,0 1,0 0
- Seite 77 und 78:
3.4 Überprüfung der Formel für S
- Seite 79 und 80:
der Charts mit Weißzumischung als
- Seite 81 und 82: 3.5 Überprüfung mit dem Ostwaldsc
- Seite 83 und 84: 3.6 Zusammenfassende Schlussfolgeru
- Seite 85 und 86: Flächendeckungsgrad Schwarz L Flä
- Seite 87 und 88: Effekt, wird von der Formel für S
- Seite 89 und 90: Man erkennt in Abb. 4.1.8 den Platz
- Seite 91 und 92: 160 140 120 100 80 60 40 20 0 -20 -
- Seite 93 und 94: Abb. 4.2.5 Teil der grüngelben Ebe
- Seite 95 und 96: Abb. 4.2.8 Farbtonebene 160 des RAL
- Seite 97 und 98: 4.3 Farb-Ellipsen Man spricht im al
- Seite 99 und 100: Abb. 4.4.2 zeigt ein Beispiel für
- Seite 101 und 102: y 0,5 0,45 0,4 0,35 0,3 0,25 0,2 0,
- Seite 103 und 104: • Max Becke (Direktor des Textilf
- Seite 105 und 106: Rezeptoren Gegenfarben- Zellen im C
- Seite 107 und 108: 5. Zusammenfassung Die Buntheit, so
- Seite 109 und 110: Literatur 1. Adams, E. Q., Cobb, P.
- Seite 111 und 112: 36. Hill, B., Roger, Th., Vorhagen,
- Seite 113 und 114: 67. Luque, M. J., Capilla, P., Feli
- Seite 115 und 116: 101. Walraven, P. L. The absorption
- Seite 117 und 118: Anhang A1. Sättigung im CIECAM Sys
- Seite 119 und 120: Wobei α = Yw / Ywr ein Faktor ist,
- Seite 121 und 122: A2. Tabellen A2.1 Folienmessung (Gr
- Seite 123 und 124: Fortsetzung Tabelle T S A0 hxy r1 X
- Seite 125 und 126: Fortsetzung Tabelle T S A0 hxy r1 X
- Seite 127 und 128: Helligkeit der Dunkelstufen der DIN
- Seite 129 und 130: A2.5 Messwerte zur Farbton-Harmonie
- Seite 131: 131
- Seite 135 und 136: L* a* b* X Y Z x y Y 16 30,95 -28,0
- Seite 137 und 138: L* a* b* X Y Z x y Y 20 67,25 0,79
- Seite 139 und 140: L* a* b* x y Y C S + 6 66,9 27,27 6
- Seite 141 und 142: L* a* b* x y Y C S + 10 90,68 -4,42
- Seite 143 und 144: P1 P2 P3 P4 P5 P6 P7 P8 P9 P10 P11
- Seite 145 und 146: P1 P2 P3 P4 P5 P6 P7 P8 P9 P10 P11
- Seite 147 und 148: R x y HN Y a' b' L a* b* C 4 0,483
- Seite 149 und 150: S + 100.0 90.0 80.0 70.0 60.0 50.0
- Seite 151 und 152: C* ab 180.0 160.0 140.0 120.0 100.0
- Seite 153 und 154: + 160 140 120 100 80 60 40 20 0 -20
- Seite 155 und 156: 160 140 120 100 80 60 40 20 0 -20 -
- Seite 157: Abb.3.28 Optimalfarben für L* =90