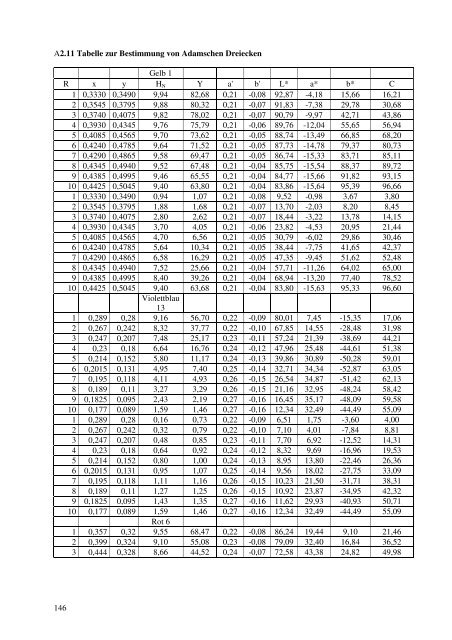
A2.11 Tabelle zur Best<strong>im</strong>mung von Adamschen Dreiecken 146 Gelb 1 R x y HN Y a' b' L* a* b* C 1 0,3330 0,3490 9,94 82,68 0,21 -0,08 92,87 -4,18 15,66 16,21 2 0,3545 0,3795 9,88 80,32 0,21 -0,07 91,83 -7,38 29,78 30,68 3 0,3740 0,4075 9,82 78,02 0,21 -0,07 90,79 -9,97 42,71 43,86 4 0,3930 0,4345 9,76 75,79 0,21 -0,06 89,76 -12,04 55,65 56,94 5 0,4085 0,4565 9,70 73,62 0,21 -0,05 88,74 -13,49 66,85 68,20 6 0,4240 0,4785 9,64 71,52 0,21 -0,05 87,73 -14,78 79,37 80,73 7 0,4290 0,4865 9,58 69,47 0,21 -0,05 86,74 -15,33 83,71 85,11 8 0,4345 0,4940 9,52 67,48 0,21 -0,04 85,75 -15,54 88,37 89,72 9 0,4385 0,4995 9,46 65,55 0,21 -0,04 84,77 -15,66 91,82 93,15 10 0,4425 0,5045 9,40 63,80 0,21 -0,04 83,86 -15,64 95,39 96,66 1 0,3330 0,3490 0,94 1,07 0,21 -0,08 9,52 -0,98 3,67 3,80 2 0,3545 0,3795 1,88 1,68 0,21 -0,07 13,70 -2,03 8,20 8,45 3 0,3740 0,4075 2,80 2,62 0,21 -0,07 18,44 -3,22 13,78 14,15 4 0,3930 0,4345 3,70 4,05 0,21 -0,06 23,82 -4,53 20,95 21,44 5 0,4085 0,4565 4,70 6,56 0,21 -0,05 30,79 -6,02 29,86 30,46 6 0,4240 0,4785 5,64 10,34 0,21 -0,05 38,44 -7,75 41,65 42,37 7 0,4290 0,4865 6,58 16,29 0,21 -0,05 47,35 -9,45 51,62 52,48 8 0,4345 0,4940 7,52 25,66 0,21 -0,04 57,71 -11,26 64,02 65,00 9 0,4385 0,4995 8,40 39,26 0,21 -0,04 68,94 -13,20 77,40 78,52 10 0,4425 0,5045 9,40 63,68 0,21 -0,04 83,80 -15,63 95,33 96,60 Violettblau 13 1 0,289 0,28 9,16 56,70 0,22 -0,09 80,01 7,45 -15,35 17,06 2 0,267 0,242 8,32 37,77 0,22 -0,10 67,85 14,55 -28,48 31,98 3 0,247 0,207 7,48 25,17 0,23 -0,11 57,24 21,39 -38,69 44,21 4 0,23 0,18 6,64 16,76 0,24 -0,12 47,96 25,48 -44,61 51,38 5 0,214 0,152 5,80 11,17 0,24 -0,13 39,86 30,89 -50,28 59,01 6 0,2015 0,131 4,95 7,40 0,25 -0,14 32,71 34,34 -52,87 63,05 7 0,195 0,118 4,11 4,93 0,26 -0,15 26,54 34,87 -51,42 62,13 8 0,189 0,11 3,27 3,29 0,26 -0,15 21,16 32,95 -48,24 58,42 9 0,1825 0,095 2,43 2,19 0,27 -0,16 16,45 35,17 -48,09 59,58 10 0,177 0,089 1,59 1,46 0,27 -0,16 12,34 32,49 -44,49 55,09 1 0,289 0,28 0,16 0,73 0,22 -0,09 6,51 1,75 -3,60 4,00 2 0,267 0,242 0,32 0,79 0,22 -0,10 7,10 4,01 -7,84 8,81 3 0,247 0,207 0,48 0,85 0,23 -0,11 7,70 6,92 -12,52 14,31 4 0,23 0,18 0,64 0,92 0,24 -0,12 8,32 9,69 -16,96 19,53 5 0,214 0,152 0,80 1,00 0,24 -0,13 8,95 13,80 -22,46 26,36 6 0,2015 0,131 0,95 1,07 0,25 -0,14 9,56 18,02 -27,75 33,09 7 0,195 0,118 1,11 1,16 0,26 -0,15 10,23 21,50 -31,71 38,31 8 0,189 0,11 1,27 1,25 0,26 -0,15 10,92 23,87 -34,95 42,32 9 0,1825 0,095 1,43 1,35 0,27 -0,16 11,62 29,93 -40,93 50,71 10 0,177 0,089 1,59 1,46 0,27 -0,16 12,34 32,49 -44,49 55,09 Rot 6 1 0,357 0,32 9,55 68,47 0,22 -0,08 86,24 19,44 9,10 21,46 2 0,399 0,324 9,10 55,08 0,23 -0,08 79,09 32,40 16,84 36,52 3 0,444 0,328 8,66 44,52 0,24 -0,07 72,58 43,38 24,82 49,98
R x y HN Y a' b' L a* b* C 4 0,483 0,332 8,21 35,82 0,25 -0,07 66,38 50,16 31,38 59,17 5 0,52 0,335 7,76 28,81 0,25 -0,06 60,62 54,88 37,48 66,46 6 0,551 0,337 7,31 23,18 0,26 -0,06 55,26 57,11 42,41 71,14 7 0,5595 0,338 6,86 18,65 0,26 -0,05 50,27 54,52 41,69 68,63 R x y HN Y a' b' L* a* b* C 8 0,572 0,339 6,42 15,07 0,26 -0,05 45,73 52,81 42,01 67,48 9 0,58 0,34 5,97 12,13 0,26 -0,05 41,41 50,20 41,22 64,96 10 0,588 0,34 5,52 9,75 0,26 -0,05 37,40 47,95 40,19 62,57 1 0,357 0,32 0,55 0,88 0,22 -0,08 7,97 4,56 2,13 5,03 2 0,399 0,324 1,10 1,15 0,23 -0,08 10,19 8,92 4,64 10,06 3 0,444 0,328 1,66 1,51 0,24 -0,07 12,66 14,04 8,03 16,17 4 0,483 0,332 2,21 1,97 0,25 -0,07 15,32 19,07 11,93 22,50 5 0,52 0,335 2,76 2,57 0,25 -0,06 18,22 24,51 16,74 29,68 6 0,551 0,337 3,31 3,35 0,26 -0,06 21,40 29,97 22,26 37,33 7 0,5595 0,338 3,86 4,37 0,26 -0,05 24,86 33,61 25,71 42,32 8 0,572 0,339 4,42 5,73 0,26 -0,05 28,72 38,26 30,43 48,89 9 0,58 0,34 4,97 7,48 0,26 -0,05 32,87 42,73 35,09 55,29 10 0,177 0,089 5,52 9,75 0,27 -0,16 37,40 61,21 -83,82 103,79 147
- Seite 3 und 4:
Sättigung im CIELAB-Farbsystem und
- Seite 5 und 6:
Kurzfassung Bisher fehlte eine Form
- Seite 7 und 8:
Inhaltsverzeichnis 0 Zielstellung -
- Seite 9 und 10:
0 Zielstellung -Motivation In den l
- Seite 11 und 12:
Abb. 1.1.2 zeigt einen horizontalen
- Seite 13 und 14:
Die Stäbchen sind Sensoren mit gr
- Seite 15 und 16:
Probe + Umfeld Absorption Auge (Ret
- Seite 17 und 18:
L* 100 90 80 70 60 50 40 30 20 10 0
- Seite 19 und 20:
Die Zellen und ihr Verhalten sind a
- Seite 21 und 22:
Unter Buntton (früher Farbton) ver
- Seite 23 und 24:
Die DIN 5033 zur Farbmessung lässt
- Seite 25 und 26:
1.1.4 Ermittelung von Empfindungsgr
- Seite 27 und 28:
Oft erfolgt die Anordnung so, dass
- Seite 29 und 30:
Abb. 1.2.4 Schiefer Doppelkegel, na
- Seite 31 und 32:
sind folgende Gleichungen definiert
- Seite 33 und 34:
F* C*ab L* C Abb. 1.2.11 Farbe F* b
- Seite 35 und 36:
Die folgende Abbildung soll den „
- Seite 37 und 38:
1.3.3 Die Sättigung im CIELUV-Farb
- Seite 39 und 40:
1.3.5 Buntheit und Sättigung im CI
- Seite 41 und 42:
Die hohen Sättigungsstufen, die vo
- Seite 43 und 44:
13 violettblau 17 Cyanblau 20 Smara
- Seite 45 und 46:
Abb. 1.3.11 Umfeldwirkung auch scho
- Seite 47 und 48:
L* Gelb-Violettblaue Ebene C* n Abb
- Seite 49 und 50:
3. Überprüfung der vorgeschlagene
- Seite 51 und 52:
Vergleicht man visuell die beiden b
- Seite 53 und 54:
100,00 90,00 80,00 70,00 60,00 50,0
- Seite 55 und 56:
0,7 0,6 0,5 0,4 0,3 0,2 0,1 Grüne
- Seite 57 und 58:
90 80 70 60 50 40 30 20 10 Sättigu
- Seite 59 und 60:
ausgesprochen gleichmäßigen Verla
- Seite 61 und 62:
Farbscheiben gesorgt; kleine Ausgle
- Seite 63 und 64:
Abb. 3.3.10 Transformation der Mess
- Seite 65 und 66:
Abb. 3.3.12 Reinheitsstufen in der
- Seite 67 und 68:
Dass unterschiedlich viele Sättigu
- Seite 69 und 70:
S Abb. 3.3.18 Berechnete Sättigung
- Seite 71 und 72:
S + 40 35 30 25 S 20 15 10 5 0 T 21
- Seite 73 und 74:
Man erkennt, dass eine Korrektur mi
- Seite 75 und 76:
d 8,0 7,0 6,0 5,0 4,0 3,0 2,0 1,0 0
- Seite 77 und 78:
3.4 Überprüfung der Formel für S
- Seite 79 und 80:
der Charts mit Weißzumischung als
- Seite 81 und 82:
3.5 Überprüfung mit dem Ostwaldsc
- Seite 83 und 84:
3.6 Zusammenfassende Schlussfolgeru
- Seite 85 und 86:
Flächendeckungsgrad Schwarz L Flä
- Seite 87 und 88:
Effekt, wird von der Formel für S
- Seite 89 und 90:
Man erkennt in Abb. 4.1.8 den Platz
- Seite 91 und 92:
160 140 120 100 80 60 40 20 0 -20 -
- Seite 93 und 94:
Abb. 4.2.5 Teil der grüngelben Ebe
- Seite 95 und 96: Abb. 4.2.8 Farbtonebene 160 des RAL
- Seite 97 und 98: 4.3 Farb-Ellipsen Man spricht im al
- Seite 99 und 100: Abb. 4.4.2 zeigt ein Beispiel für
- Seite 101 und 102: y 0,5 0,45 0,4 0,35 0,3 0,25 0,2 0,
- Seite 103 und 104: • Max Becke (Direktor des Textilf
- Seite 105 und 106: Rezeptoren Gegenfarben- Zellen im C
- Seite 107 und 108: 5. Zusammenfassung Die Buntheit, so
- Seite 109 und 110: Literatur 1. Adams, E. Q., Cobb, P.
- Seite 111 und 112: 36. Hill, B., Roger, Th., Vorhagen,
- Seite 113 und 114: 67. Luque, M. J., Capilla, P., Feli
- Seite 115 und 116: 101. Walraven, P. L. The absorption
- Seite 117 und 118: Anhang A1. Sättigung im CIECAM Sys
- Seite 119 und 120: Wobei α = Yw / Ywr ein Faktor ist,
- Seite 121 und 122: A2. Tabellen A2.1 Folienmessung (Gr
- Seite 123 und 124: Fortsetzung Tabelle T S A0 hxy r1 X
- Seite 125 und 126: Fortsetzung Tabelle T S A0 hxy r1 X
- Seite 127 und 128: Helligkeit der Dunkelstufen der DIN
- Seite 129 und 130: A2.5 Messwerte zur Farbton-Harmonie
- Seite 131 und 132: 131
- Seite 133 und 134: A2.7 Messung des PCCS System (Greta
- Seite 135 und 136: L* a* b* X Y Z x y Y 16 30,95 -28,0
- Seite 137 und 138: L* a* b* X Y Z x y Y 20 67,25 0,79
- Seite 139 und 140: L* a* b* x y Y C S + 6 66,9 27,27 6
- Seite 141 und 142: L* a* b* x y Y C S + 10 90,68 -4,42
- Seite 143 und 144: P1 P2 P3 P4 P5 P6 P7 P8 P9 P10 P11
- Seite 145: P1 P2 P3 P4 P5 P6 P7 P8 P9 P10 P11
- Seite 149 und 150: S + 100.0 90.0 80.0 70.0 60.0 50.0
- Seite 151 und 152: C* ab 180.0 160.0 140.0 120.0 100.0
- Seite 153 und 154: + 160 140 120 100 80 60 40 20 0 -20
- Seite 155 und 156: 160 140 120 100 80 60 40 20 0 -20 -
- Seite 157: Abb.3.28 Optimalfarben für L* =90