English version - Fit for Work Europe
English version - Fit for Work Europe
English version - Fit for Work Europe

Create successful ePaper yourself
Turn your PDF publications into a flip-book with our unique Google optimized e-Paper software.
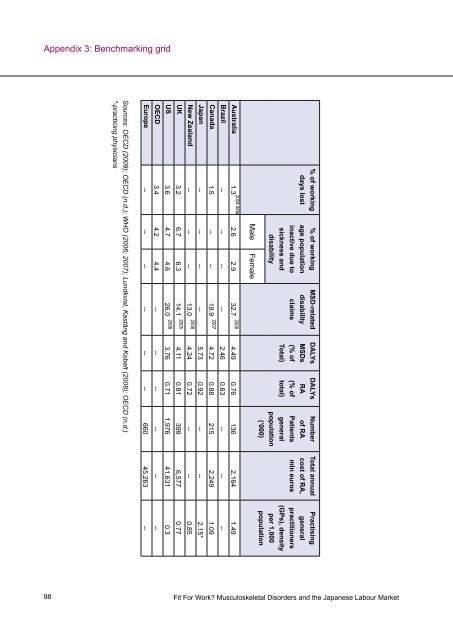
Appendix 3: Benchmarking grid<br />
98<br />
Sources: OECD (2009); OECD (n.d.); WHO (2006; 2007); Lundkvist, Kastäng and Kobelt (2008); OECD (n.d.)<br />
*-practicing physicians<br />
OECD 3.4 4.2 4.4 -- -- -- -- -- --<br />
<strong>Europe</strong> -- -- -- -- -- -- 660 45,263 --<br />
2004 data 2008<br />
Australia 1.3 2.6 2.9 32.7 4.49 0.76 136 2,164 1.49<br />
Brazil -- -- -- -- 2.46 0.63 -- -- --<br />
Canada 2007<br />
1.5 -- -- 19.9 4.72 0.88 215 2,249 1.09<br />
Japan -- -- -- -- 5.73 0.92 -- -- 2.15*<br />
2008<br />
New Zealand -- -- -- 13.0 4.24 0.72 -- -- 0.85<br />
UK 2005<br />
3.2 6.7 6.3 14.1 4.11 0.81 399 6,577 0.77<br />
US 2008<br />
3.6 4.7 4.6 26.0 3.76 0.71 1,976 41,631 0.3<br />
Male Female<br />
% of working<br />
days lost<br />
% of working<br />
age population<br />
inactive due to<br />
sickness and<br />
disability<br />
Total)<br />
MSD-related<br />
disability<br />
claims<br />
DALYs<br />
MSDs<br />
(% of<br />
DALYs<br />
RA<br />
(% of<br />
total)<br />
Number<br />
of RA<br />
Patients<br />
general<br />
population<br />
(‘000)<br />
Total annual<br />
cost of RA,<br />
<strong>Fit</strong> For <strong>Work</strong>? Musculoskeletal Disorders and the Japanese Labour Market<br />
mln euros<br />
Practising<br />
general<br />
practitioners<br />
(GPs), density<br />
per 1,000<br />
population