Migration in Burundi: History, Current Trends and Future - MGSoG ...
Migration in Burundi: History, Current Trends and Future - MGSoG ...
Migration in Burundi: History, Current Trends and Future - MGSoG ...

You also want an ePaper? Increase the reach of your titles
YUMPU automatically turns print PDFs into web optimized ePapers that Google loves.
educational system <strong>in</strong> <strong>Burundi</strong>, one that was already weak before the war (Jackson, 2000).<br />
In addition, children often start work<strong>in</strong>g at a young age <strong>in</strong> <strong>Burundi</strong>: by the age of 13, 42<br />
percent of the children are already work<strong>in</strong>g (Garcia & Fares, 2007).<br />
2.2 Culture <strong>and</strong> ethnicity<br />
<strong>Burundi</strong> consists of three primary ethnic groups: the Hutu (Bantu), the Tutsi (Hamitic),<br />
<strong>and</strong> the Twa (Pygmy). Eighty-five percent of <strong>Burundi</strong>’s population is Hutu, 14 percent is<br />
Tutsi, <strong>and</strong> 1 percent is Twa (Makoba & Ndura, 2006). The ma<strong>in</strong> languages spoken <strong>in</strong><br />
<strong>Burundi</strong> are Kirundi, French, <strong>and</strong> Swahili. Both Kirundi <strong>and</strong> French are recognized as<br />
official languages, but most people speak Kirundi. Most of the <strong>Burundi</strong>an population is<br />
Christian (67 percent), 23 percent follows traditional <strong>in</strong>digenous beliefs, <strong>and</strong> 10 percent is<br />
Muslim.<br />
Both before <strong>and</strong> after the colonial period, which took place between 1897 <strong>and</strong><br />
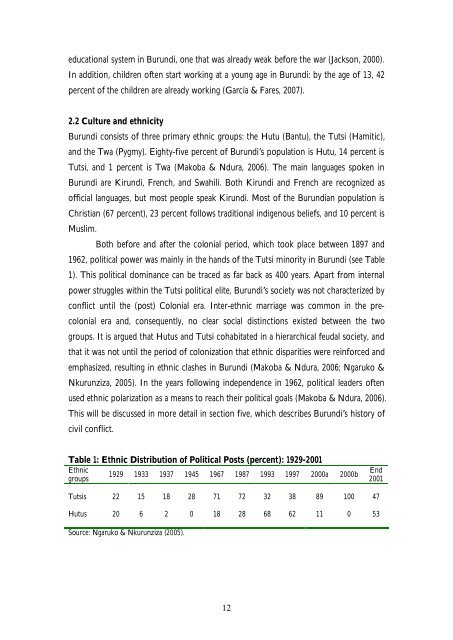
1962, political power was ma<strong>in</strong>ly <strong>in</strong> the h<strong>and</strong>s of the Tutsi m<strong>in</strong>ority <strong>in</strong> <strong>Burundi</strong> (see Table<br />
1). This political dom<strong>in</strong>ance can be traced as far back as 400 years. Apart from <strong>in</strong>ternal<br />
power struggles with<strong>in</strong> the Tutsi political elite, <strong>Burundi</strong>’s society was not characterized by<br />
conflict until the (post) Colonial era. Inter-ethnic marriage was common <strong>in</strong> the pre-<br />
colonial era <strong>and</strong>, consequently, no clear social dist<strong>in</strong>ctions existed between the two<br />
groups. It is argued that Hutus <strong>and</strong> Tutsi cohabitated <strong>in</strong> a hierarchical feudal society, <strong>and</strong><br />
that it was not until the period of colonization that ethnic disparities were re<strong>in</strong>forced <strong>and</strong><br />
emphasized, result<strong>in</strong>g <strong>in</strong> ethnic clashes <strong>in</strong> <strong>Burundi</strong> (Makoba & Ndura, 2006; Ngaruko &<br />
Nkurunziza, 2005). In the years follow<strong>in</strong>g <strong>in</strong>dependence <strong>in</strong> 1962, political leaders often<br />
used ethnic polarization as a means to reach their political goals (Makoba & Ndura, 2006).<br />
This will be discussed <strong>in</strong> more detail <strong>in</strong> section five, which describes <strong>Burundi</strong>’s history of<br />
civil conflict.<br />
Table 1: Ethnic Distribution of Political Posts (percent): 1929-2001<br />
Ethnic<br />
groups<br />
1929 1933 1937 1945 1967 1987 1993 1997 2000a 2000b<br />
Tutsis 22 15 18 28 71 72 32 38 89 100 47<br />
Hutus 20 6 2 0 18 28 68 62 11 0 53<br />
Source: Ngaruko & Nkurunziza (2005).<br />
12<br />
End<br />
2001