Migration in Burundi: History, Current Trends and Future - MGSoG ...
Migration in Burundi: History, Current Trends and Future - MGSoG ...
Migration in Burundi: History, Current Trends and Future - MGSoG ...

Create successful ePaper yourself
Turn your PDF publications into a flip-book with our unique Google optimized e-Paper software.
President Pierre Buyoya also led to <strong>in</strong>creased food prices, a development that highly<br />
affected nutritional states of rural households (Bundervoet & Verwimp, 2005). 2<br />
Nkurunziza <strong>and</strong> Ngaruko (2002) call <strong>Burundi</strong>’s economic performance <strong>in</strong> the<br />
period of 1960 to 2000 “catastrophic” (p. 1), <strong>and</strong> po<strong>in</strong>t ma<strong>in</strong>ly to political causes or the<br />
side effects of bad governance. Basdevant (2009) summarizes the causes of low<br />
<strong>Burundi</strong>an growth rates as: “Lack of <strong>in</strong>vestment, civil conflict, economic <strong>in</strong>efficiencies,<br />
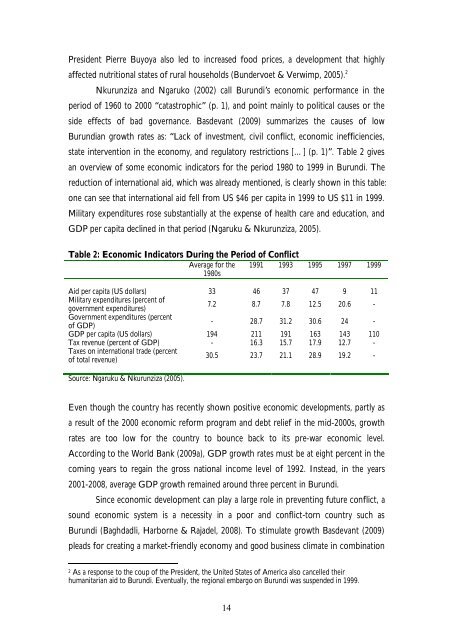
state <strong>in</strong>tervention <strong>in</strong> the economy, <strong>and</strong> regulatory restrictions [… ] (p. 1)”. Table 2 gives<br />
an overview of some economic <strong>in</strong>dicators for the period 1980 to 1999 <strong>in</strong> <strong>Burundi</strong>. The<br />
reduction of <strong>in</strong>ternational aid, which was already mentioned, is clearly shown <strong>in</strong> this table:<br />
one can see that <strong>in</strong>ternational aid fell from US $46 per capita <strong>in</strong> 1999 to US $11 <strong>in</strong> 1999.<br />
Military expenditures rose substantially at the expense of health care <strong>and</strong> education, <strong>and</strong><br />
GDP per capita decl<strong>in</strong>ed <strong>in</strong> that period (Ngaruku & Nkurunziza, 2005).<br />
Table 2: Economic Indicators Dur<strong>in</strong>g the Period of Conflict<br />
Average for the<br />
1980s<br />
1991 1993 1995 1997 1999<br />
Aid per capita (US dollars) 33 46 37 47 9 11<br />
Military expenditures (percent of<br />
government expenditures)<br />
7.2 8.7 7.8 12.5 20.6 -<br />
Government expenditures (percent<br />
of GDP)<br />
- 28.7 31.2 30.6 24 -<br />
GDP per capita (US dollars) 194 211 191 163 143 110<br />
Tax revenue (percent of GDP) - 16.3 15.7 17.9 12.7 -<br />
Taxes on <strong>in</strong>ternational trade (percent<br />
of total revenue)<br />
30.5 23.7 21.1 28.9 19.2 -<br />
Source: Ngaruku & Nkurunziza (2005).<br />
Even though the country has recently shown positive economic developments, partly as<br />
a result of the 2000 economic reform program <strong>and</strong> debt relief <strong>in</strong> the mid-2000s, growth<br />
rates are too low for the country to bounce back to its pre-war economic level.<br />
Accord<strong>in</strong>g to the World Bank (2009a), GDP growth rates must be at eight percent <strong>in</strong> the<br />
com<strong>in</strong>g years to rega<strong>in</strong> the gross national <strong>in</strong>come level of 1992. Instead, <strong>in</strong> the years<br />
2001-2008, average GDP growth rema<strong>in</strong>ed around three percent <strong>in</strong> <strong>Burundi</strong>.<br />
S<strong>in</strong>ce economic development can play a large role <strong>in</strong> prevent<strong>in</strong>g future conflict, a<br />
sound economic system is a necessity <strong>in</strong> a poor <strong>and</strong> conflict-torn country such as<br />
<strong>Burundi</strong> (Baghdadli, Harborne & Rajadel, 2008). To stimulate growth Basdevant (2009)<br />
pleads for creat<strong>in</strong>g a market-friendly economy <strong>and</strong> good bus<strong>in</strong>ess climate <strong>in</strong> comb<strong>in</strong>ation<br />
2 As a response to the coup of the President, the United States of America also cancelled their<br />
humanitarian aid to <strong>Burundi</strong>. Eventually, the regional embargo on <strong>Burundi</strong> was suspended <strong>in</strong> 1999.<br />
14