Rural Income Generation and Diversification - A Case Study ... - Doria
Rural Income Generation and Diversification - A Case Study ... - Doria
Rural Income Generation and Diversification - A Case Study ... - Doria

Create successful ePaper yourself
Turn your PDF publications into a flip-book with our unique Google optimized e-Paper software.
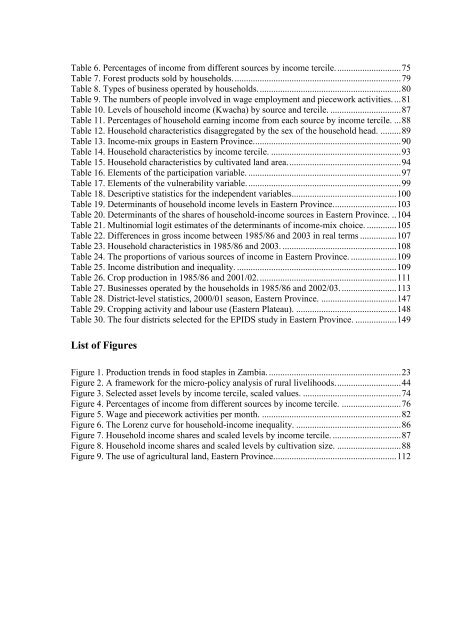
Table 6. Percentages of income from different sources by income tercile. ............................ 75<br />
Table 7. Forest products sold by households. ......................................................................... 79<br />
Table 8. Types of business operated by households. .............................................................. 80<br />
Table 9. The numbers of people involved in wage employment <strong>and</strong> piecework activities. ... 81<br />
Table 10. Levels of household income (Kwacha) by source <strong>and</strong> tercile. ............................... 87<br />
Table 11. Percentages of household earning income from each source by income tercile. ... 88<br />
Table 12. Household characteristics disaggregated by the sex of the household head. ......... 89<br />
Table 13. <strong>Income</strong>-mix groups in Eastern Province. ................................................................ 90<br />
Table 14. Household characteristics by income tercile. ......................................................... 93<br />
Table 15. Household characteristics by cultivated l<strong>and</strong> area. ................................................. 94<br />
Table 16. Elements of the participation variable. ................................................................... 97<br />
Table 17. Elements of the vulnerability variable. ................................................................... 99<br />
Table 18. Descriptive statistics for the independent variables .............................................. 100<br />
Table 19. Determinants of household income levels in Eastern Province. ........................... 103<br />
Table 20. Determinants of the shares of household-income sources in Eastern Province. .. 104<br />
Table 21. Multinomial logit estimates of the determinants of income-mix choice. ............. 105<br />
Table 22. Differences in gross income between 1985/86 <strong>and</strong> 2003 in real terms ................ 107<br />
Table 23. Household characteristics in 1985/86 <strong>and</strong> 2003. .................................................. 108<br />
Table 24. The proportions of various sources of income in Eastern Province. .................... 109<br />
Table 25. <strong>Income</strong> distribution <strong>and</strong> inequality. ...................................................................... 109<br />
Table 26. Crop production in 1985/86 <strong>and</strong> 2001/02. ............................................................ 111<br />
Table 27. Businesses operated by the households in 1985/86 <strong>and</strong> 2002/03. ........................ 113<br />
Table 28. District-level statistics, 2000/01 season, Eastern Province. ................................. 147<br />
Table 29. Cropping activity <strong>and</strong> labour use (Eastern Plateau). ............................................ 148<br />
Table 30. The four districts selected for the EPIDS study in Eastern Province. .................. 149<br />
List of Figures<br />
Figure 1. Production trends in food staples in Zambia. .......................................................... 23<br />
Figure 2. A framework for the micro-policy analysis of rural livelihoods. ............................ 44<br />
Figure 3. Selected asset levels by income tercile, scaled values. ........................................... 74<br />
Figure 4. Percentages of income from different sources by income tercile. .......................... 76<br />
Figure 5. Wage <strong>and</strong> piecework activities per month. ............................................................. 82<br />
Figure 6. The Lorenz curve for household-income inequality. .............................................. 86<br />
Figure 7. Household income shares <strong>and</strong> scaled levels by income tercile. .............................. 87<br />
Figure 8. Household income shares <strong>and</strong> scaled levels by cultivation size. ............................ 88<br />
Figure 9. The use of agricultural l<strong>and</strong>, Eastern Province. ..................................................... 112