Rural Income Generation and Diversification - A Case Study ... - Doria
Rural Income Generation and Diversification - A Case Study ... - Doria
Rural Income Generation and Diversification - A Case Study ... - Doria

You also want an ePaper? Increase the reach of your titles
YUMPU automatically turns print PDFs into web optimized ePapers that Google loves.
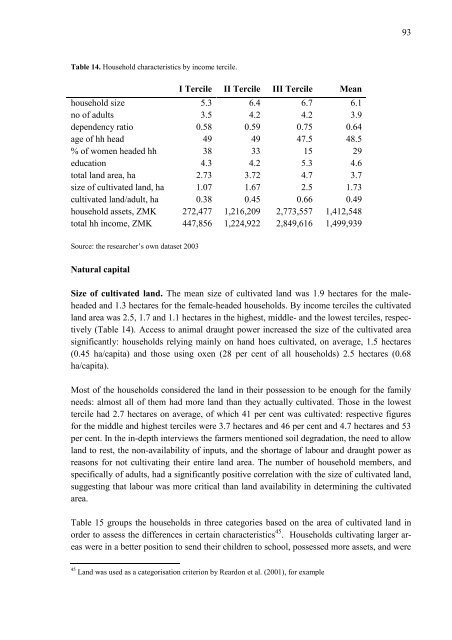
Table 14. Household characteristics by income tercile.<br />
I Tercile II Tercile III Tercile Mean<br />
household size 5.3 6.4 6.7 6.1<br />
no of adults 3.5 4.2 4.2 3.9<br />
dependency ratio 0.58 0.59 0.75 0.64<br />
age of hh head 49 49 47.5 48.5<br />
% of women headed hh 38 33 15 29<br />
education 4.3 4.2 5.3 4.6<br />
total l<strong>and</strong> area, ha 2.73 3.72 4.7 3.7<br />
size of cultivated l<strong>and</strong>, ha 1.07 1.67 2.5 1.73<br />
cultivated l<strong>and</strong>/adult, ha 0.38 0.45 0.66 0.49<br />
household assets, ZMK 272,477 1,216,209 2,773,557 1,412,548<br />
total hh income, ZMK 447,856 1,224,922 2,849,616 1,499,939<br />
Source: the researcher’s own dataset 2003<br />
Natural capital<br />
Size of cultivated l<strong>and</strong>. The mean size of cultivated l<strong>and</strong> was 1.9 hectares for the maleheaded<br />
<strong>and</strong> 1.3 hectares for the female-headed households. By income terciles the cultivated<br />
l<strong>and</strong> area was 2.5, 1.7 <strong>and</strong> 1.1 hectares in the highest, middle- <strong>and</strong> the lowest terciles, respectively<br />
(Table 14). Access to animal draught power increased the size of the cultivated area<br />
significantly: households relying mainly on h<strong>and</strong> hoes cultivated, on average, 1.5 hectares<br />
(0.45 ha/capita) <strong>and</strong> those using oxen (28 per cent of all households) 2.5 hectares (0.68<br />
ha/capita).<br />
Most of the households considered the l<strong>and</strong> in their possession to be enough for the family<br />
needs: almost all of them had more l<strong>and</strong> than they actually cultivated. Those in the lowest<br />
tercile had 2.7 hectares on average, of which 41 per cent was cultivated: respective figures<br />
for the middle <strong>and</strong> highest terciles were 3.7 hectares <strong>and</strong> 46 per cent <strong>and</strong> 4.7 hectares <strong>and</strong> 53<br />
per cent. In the in-depth interviews the farmers mentioned soil degradation, the need to allow<br />
l<strong>and</strong> to rest, the non-availability of inputs, <strong>and</strong> the shortage of labour <strong>and</strong> draught power as<br />
reasons for not cultivating their entire l<strong>and</strong> area. The number of household members, <strong>and</strong><br />
specifically of adults, had a significantly positive correlation with the size of cultivated l<strong>and</strong>,<br />
suggesting that labour was more critical than l<strong>and</strong> availability in determining the cultivated<br />
area.<br />
Table 15 groups the households in three categories based on the area of cultivated l<strong>and</strong> in<br />
order to assess the differences in certain characteristics 45 . Households cultivating larger areas<br />
were in a better position to send their children to school, possessed more assets, <strong>and</strong> were<br />
45 L<strong>and</strong> was used as a categorisation criterion by Reardon et al. (2001), for example<br />
93