Rural Income Generation and Diversification - A Case Study ... - Doria
Rural Income Generation and Diversification - A Case Study ... - Doria
Rural Income Generation and Diversification - A Case Study ... - Doria
You also want an ePaper? Increase the reach of your titles
YUMPU automatically turns print PDFs into web optimized ePapers that Google loves.
94<br />
more likely to use fertilisers <strong>and</strong> ox-draft power than those cultivating smaller areas. They<br />
ranked highest in terms of total income <strong>and</strong> in the proportion of farm income, <strong>and</strong> were less<br />
likely to be headed by a woman.<br />
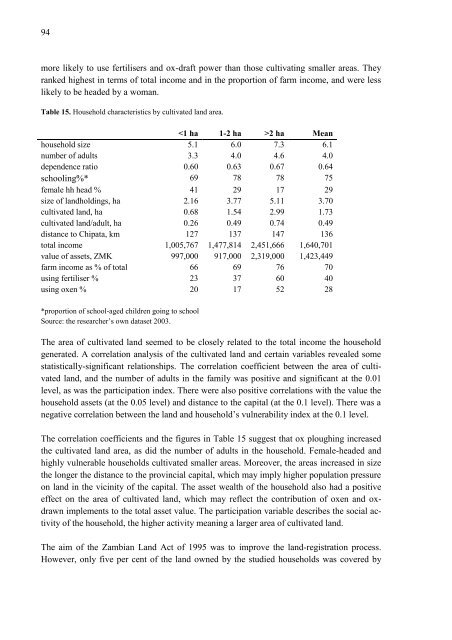
Table 15. Household characteristics by cultivated l<strong>and</strong> area.<br />
2 ha Mean<br />
household size 5.1 6.0 7.3 6.1<br />
number of adults 3.3 4.0 4.6 4.0<br />
dependence ratio 0.60 0.63 0.67 0.64<br />
schooling%* 69 78 78 75<br />
female hh head % 41 29 17 29<br />
size of l<strong>and</strong>holdings, ha 2.16 3.77 5.11 3.70<br />
cultivated l<strong>and</strong>, ha 0.68 1.54 2.99 1.73<br />
cultivated l<strong>and</strong>/adult, ha 0.26 0.49 0.74 0.49<br />
distance to Chipata, km 127 137 147 136<br />
total income 1,005,767 1,477,814 2,451,666 1,640,701<br />
value of assets, ZMK 997,000 917,000 2,319,000 1,423,449<br />
farm income as % of total 66 69 76 70<br />
using fertiliser % 23 37 60 40<br />
using oxen % 20 17 52 28<br />
*proportion of school-aged children going to school<br />
Source: the researcher’s own dataset 2003.<br />
The area of cultivated l<strong>and</strong> seemed to be closely related to the total income the household<br />
generated. A correlation analysis of the cultivated l<strong>and</strong> <strong>and</strong> certain variables revealed some<br />
statistically-significant relationships. The correlation coefficient between the area of cultivated<br />
l<strong>and</strong>, <strong>and</strong> the number of adults in the family was positive <strong>and</strong> significant at the 0.01<br />
level, as was the participation index. There were also positive correlations with the value the<br />
household assets (at the 0.05 level) <strong>and</strong> distance to the capital (at the 0.1 level). There was a<br />
negative correlation between the l<strong>and</strong> <strong>and</strong> household’s vulnerability index at the 0.1 level.<br />
The correlation coefficients <strong>and</strong> the figures in Table 15 suggest that ox ploughing increased<br />
the cultivated l<strong>and</strong> area, as did the number of adults in the household. Female-headed <strong>and</strong><br />
highly vulnerable households cultivated smaller areas. Moreover, the areas increased in size<br />
the longer the distance to the provincial capital, which may imply higher population pressure<br />
on l<strong>and</strong> in the vicinity of the capital. The asset wealth of the household also had a positive<br />
effect on the area of cultivated l<strong>and</strong>, which may reflect the contribution of oxen <strong>and</strong> oxdrawn<br />
implements to the total asset value. The participation variable describes the social activity<br />
of the household, the higher activity meaning a larger area of cultivated l<strong>and</strong>.<br />
The aim of the Zambian L<strong>and</strong> Act of 1995 was to improve the l<strong>and</strong>-registration process.<br />
However, only five per cent of the l<strong>and</strong> owned by the studied households was covered by


