Rural Income Generation and Diversification - A Case Study ... - Doria
Rural Income Generation and Diversification - A Case Study ... - Doria
Rural Income Generation and Diversification - A Case Study ... - Doria

You also want an ePaper? Increase the reach of your titles
YUMPU automatically turns print PDFs into web optimized ePapers that Google loves.
88<br />
100<br />
90<br />
80<br />
70<br />
60<br />
50<br />
40<br />
30<br />
20<br />
10<br />
0<br />
≤ 1 ha 1- 2 ha ≥ 2 ha<br />
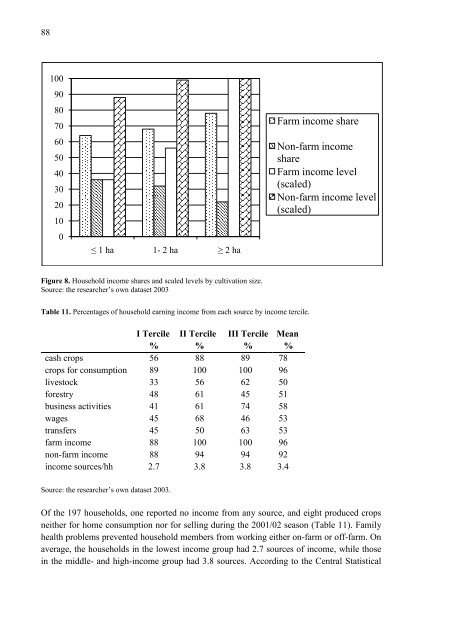
Figure 8. Household income shares <strong>and</strong> scaled levels by cultivation size.<br />
Source: the researcher’s own dataset 2003<br />
Table 11. Percentages of household earning income from each source by income tercile.<br />
I Tercile II Tercile III Tercile Mean<br />
% % % %<br />
cash crops 56 88 89 78<br />
crops for consumption 89 100 100 96<br />
livestock 33 56 62 50<br />
forestry 48 61 45 51<br />
business activities 41 61 74 58<br />
wages 45 68 46 53<br />
transfers 45 50 63 53<br />
farm income 88 100 100 96<br />
non-farm income 88 94 94 92<br />
income sources/hh 2.7 3.8 3.8 3.4<br />
Source: the researcher’s own dataset 2003.<br />
Farm income share<br />
Non-farm income<br />
share<br />
Farm income level<br />
(scaled)<br />
Non-farm income level<br />
(scaled)<br />
Of the 197 households, one reported no income from any source, <strong>and</strong> eight produced crops<br />
neither for home consumption nor for selling during the 2001/02 season (Table 11). Family<br />
health problems prevented household members from working either on-farm or off-farm. On<br />
average, the households in the lowest income group had 2.7 sources of income, while those<br />
in the middle- <strong>and</strong> high-income group had 3.8 sources. According to the Central Statistical