Annual Report and Financial Statements 2007 - Tesco PLC
Annual Report and Financial Statements 2007 - Tesco PLC
Annual Report and Financial Statements 2007 - Tesco PLC

You also want an ePaper? Increase the reach of your titles
YUMPU automatically turns print PDFs into web optimized ePapers that Google loves.
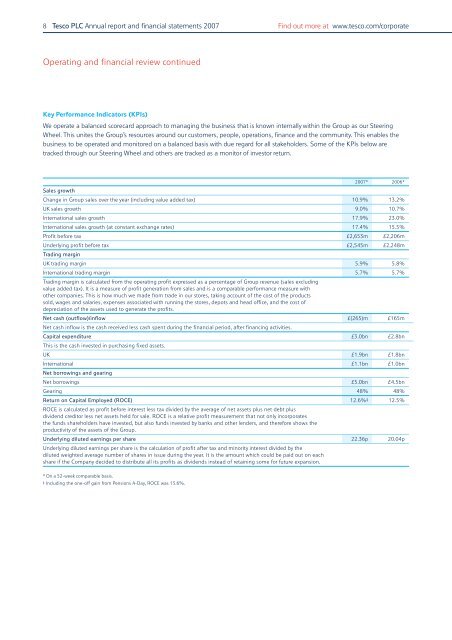
8 <strong>Tesco</strong> <strong>PLC</strong> <strong>Annual</strong> report <strong>and</strong> financial statements <strong>2007</strong> Find out more at www.tesco.com/corporate<br />
Operating <strong>and</strong> financial review continued<br />
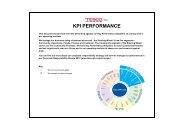
Key Performance Indicators (KPIs)<br />
We operate a balanced scorecard approach to managing the business that is known internally within the Group as our Steering<br />
Wheel. This unites the Group’s resources around our customers, people, operations, finance <strong>and</strong> the community. This enables the<br />
business to be operated <strong>and</strong> monitored on a balanced basis with due regard for all stakeholders. Some of the KPIs below are<br />
tracked through our Steering Wheel <strong>and</strong> others are tracked as a monitor of investor return.<br />
Sales growth<br />
<strong>2007</strong>* 2006*<br />
Change in Group sales over the year (including value added tax) 10.9% 13.2%<br />
UK sales growth 9.0% 10.7%<br />
International sales growth 17.9% 23.0%<br />
International sales growth (at constant exchange rates) 17.4% 15.5%<br />
Profit before tax £2,653m £2,206m<br />
Underlying profit before tax £2,545m £2,248m<br />
Trading margin<br />
UK trading margin 5.9% 5.8%<br />
International trading margin 5.7% 5.7%<br />
Trading margin is calculated from the operating profit expressed as a percentage of Group revenue (sales excluding<br />
value added tax). It is a measure of profit generation from sales <strong>and</strong> is a comparable performance measure with<br />
other companies. This is how much we made from trade in our stores, taking account of the cost of the products<br />
sold, wages <strong>and</strong> salaries, expenses associated with running the stores, depots <strong>and</strong> head office, <strong>and</strong> the cost of<br />
depreciation of the assets used to generate the profits.<br />
Net cash (outflow)/inflow £(265)m £165m<br />
Net cash inflow is the cash received less cash spent during the financial period, after financing activities.<br />
Capital expenditure £3.0bn £2.8bn<br />
This is the cash invested in purchasing fixed assets.<br />
UK £1.9bn £1.8bn<br />
International £1.1bn £1.0bn<br />
Net borrowings <strong>and</strong> gearing<br />
Net borrowings £5.0bn £4.5bn<br />
Gearing 48% 48%<br />
Return on Capital Employed (ROCE) 12.6% ‡ 12.5%<br />
ROCE is calculated as profit before interest less tax divided by the average of net assets plus net debt plus<br />
dividend creditor less net assets held for sale. ROCE is a relative profit measurement that not only incorporates<br />
the funds shareholders have invested, but also funds invested by banks <strong>and</strong> other lenders, <strong>and</strong> therefore shows the<br />
productivity of the assets of the Group.<br />
Underlying diluted earnings per share 22.36p 20.04p<br />
Underlying diluted earnings per share is the calculation of profit after tax <strong>and</strong> minority interest divided by the<br />
diluted weighted average number of shares in issue during the year. It is the amount which could be paid out on each<br />
share if the Company decided to distribute all its profits as dividends instead of retaining some for future expansion.<br />
* On a 52-week comparable basis.<br />
‡ Including the one-off gain from Pensions A-Day, ROCE was 13.6%.