

Ooyala Global Video Index: 2012 Year in Review
Ooyala Global Video Index: 2012 Year in Review
Ooyala Global Video Index: 2012 Year in Review

Create successful ePaper yourself
Turn your PDF publications into a flip-book with our unique Google optimized e-Paper software.
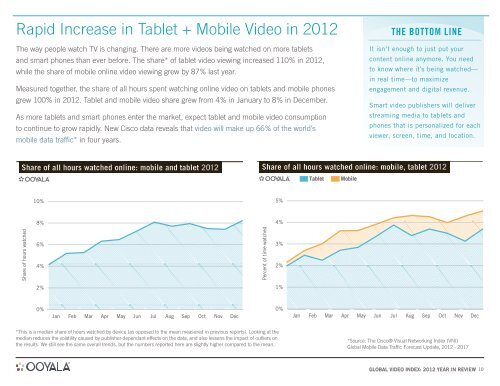
Rapid Increase <strong>in</strong> Tablet + Mobile <strong>Video</strong> <strong>in</strong> <strong>2012</strong><br />
The way people watch TV is chang<strong>in</strong>g. There are more videos be<strong>in</strong>g watched on more tablets<br />
and smart phones than ever before. The share* of tablet video view<strong>in</strong>g <strong>in</strong>creased 110% <strong>in</strong> <strong>2012</strong>,<br />
while the share of mobile onl<strong>in</strong>e video view<strong>in</strong>g grew by 87% last year.<br />
Measured together, the share of all hours spent watch<strong>in</strong>g onl<strong>in</strong>e video on tablets and mobile phones<br />
grew 100% <strong>in</strong> <strong>2012</strong>. Tablet and mobile video share grew from 4% <strong>in</strong> January to 8% <strong>in</strong> December.<br />
As more tablets and smart phones enter the market, expect tablet and mobile video consumption<br />
to cont<strong>in</strong>ue to grow rapidly. New Cisco data reveals that video will make up 66% of the world’s<br />
mobile data traffic* <strong>in</strong> four years.<br />
Share of all hours watched onl<strong>in</strong>e: mobile and tablet <strong>2012</strong><br />
Share of hours watched<br />
10%<br />
8%<br />
6%<br />
4%<br />
2%<br />
0%<br />
Jan Feb Mar Apr May Jun Jul Aug Sep Oct Nov Dec<br />
*This is a median share of hours watched by device (as opposed to the mean measured <strong>in</strong> previous reports). Look<strong>in</strong>g at the<br />
median reduces the volatility caused by publisher-dependant effects on the data, and also lessens the impact of outliers on<br />
the results. We still see the same overall trends, but the numbers reported here are slightly higher compared to the mean.<br />
the Bottom l<strong>in</strong>e<br />
It isn’t enough to just put your<br />
content onl<strong>in</strong>e anymore. You need<br />
to know where it’s be<strong>in</strong>g watched —<br />
<strong>in</strong> real time—to maximize<br />
engagement and digital revenue.<br />
Smart video publishers will deliver<br />
stream<strong>in</strong>g media to tablets and<br />
phones that is personalized for each<br />
viewer, screen, time, and location.<br />
Share of all hours watched onl<strong>in</strong>e: mobile, tablet <strong>2012</strong><br />
Percent of time watched<br />
5%<br />
4%<br />
3%<br />
2%<br />
1%<br />
0%<br />
Tablet Mobile<br />
Jan Feb Mar Apr May Jun Jul Aug Sep Oct Nov Dec<br />
*Source: The Cisco® Visual Network<strong>in</strong>g <strong>Index</strong> (VNI)<br />
<strong>Global</strong> Mobile Data Traffic Forecast Update, <strong>2012</strong> - 2017<br />
GLOBAL VIDEO INDEX: <strong>2012</strong> YEAR IN REVIEW 10