

Ooyala Global Video Index: 2012 Year in Review
Ooyala Global Video Index: 2012 Year in Review
Ooyala Global Video Index: 2012 Year in Review

You also want an ePaper? Increase the reach of your titles
YUMPU automatically turns print PDFs into web optimized ePapers that Google loves.
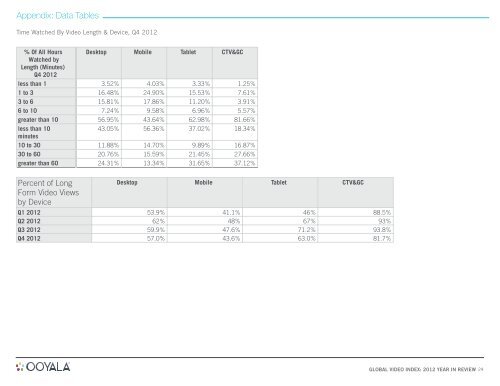
Appendix: Data Tables<br />
Time Watched By <strong>Video</strong> Length & Device, Q4 <strong>2012</strong><br />
% Of All Hours<br />
Watched by<br />
Length (M<strong>in</strong>utes)<br />
Q4 <strong>2012</strong><br />
less than 1<br />
1 to 3<br />
3 to 6<br />
6 to 10<br />
greater than 10<br />
less than 10<br />
m<strong>in</strong>utes<br />
10 to 30<br />
30 to 60<br />
greater than 60<br />
Percent of Long<br />
Form <strong>Video</strong> Views<br />
by Device<br />
Q1 <strong>2012</strong><br />
Q2 <strong>2012</strong><br />
Q3 <strong>2012</strong><br />
Q4 <strong>2012</strong><br />
Desktop Mobile Tablet CTV&GC<br />
3.52% 4.03% 3.33% 1.25%<br />
16.48% 24.90% 15.53% 7.61%<br />
15.81% 17.86% 11.20% 3.91%<br />
7.24% 9.58% 6.96% 5.57%<br />
56.95% 43.64% 62.98% 81.66%<br />
43.05% 56.36% 37.02% 18.34%<br />
11.88% 14.70% 9.89% 16.87%<br />
20.76% 15.59% 21.45% 27.66%<br />
24.31% 13.34% 31.65% 37.12%<br />
Desktop Mobile Tablet CTV&GC<br />
53.9%<br />
41.1% 46% 88.5%<br />
62% 48% 67% 93%<br />
59.9% 47.6% 71.2% 93.8%<br />
57.0% 43.6% 63.0% 81.7%<br />
GLOBAL VIDEO INDEX: <strong>2012</strong> YEAR IN REVIEW 24