

Ooyala Global Video Index: 2012 Year in Review
Ooyala Global Video Index: 2012 Year in Review
Ooyala Global Video Index: 2012 Year in Review

Create successful ePaper yourself
Turn your PDF publications into a flip-book with our unique Google optimized e-Paper software.
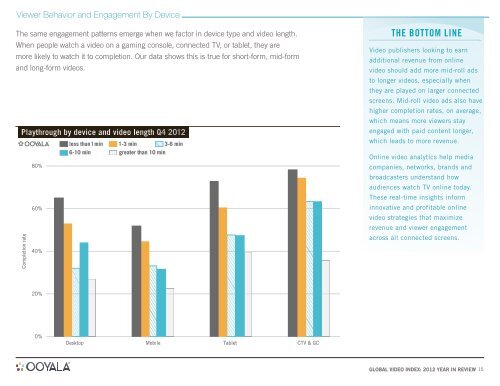
Viewer Behavior and Engagement By Device<br />
The same engagement patterns emerge when we factor <strong>in</strong> device type and video length.<br />
When people watch a video on a gam<strong>in</strong>g console, connected TV, or tablet, they are<br />
more likely to watch it to completion. Our data shows this is true for short-form, mid-form<br />
and long-form videos.<br />
Playthrough by device and video length Q4 <strong>2012</strong><br />
Completion rate<br />
80%<br />
60%<br />
40%<br />
20%<br />
0%<br />
less than 1 m<strong>in</strong><br />
6-10 m<strong>in</strong><br />
Desktop<br />
1-3 m<strong>in</strong> 3-6 m<strong>in</strong><br />
greater than 10 m<strong>in</strong><br />
Mobile<br />
Tablet<br />
CTV & GC<br />
the Bottom l<strong>in</strong>e<br />
<strong>Video</strong> publishers look<strong>in</strong>g to earn<br />
additional revenue from onl<strong>in</strong>e<br />
video should add more mid-roll ads<br />
to longer videos, especially when<br />
they are played on larger connected<br />
screens. Mid-roll video ads also have<br />
higher completion rates, on average,<br />
which means more viewers stay<br />
engaged with paid content longer,<br />
which leads to more revenue.<br />
Onl<strong>in</strong>e video analytics help media<br />
companies, networks, brands and<br />
broadcasters understand how<br />
audiences watch TV onl<strong>in</strong>e today.<br />
These real-time <strong>in</strong>sights <strong>in</strong>form<br />
<strong>in</strong>novative and profitable onl<strong>in</strong>e<br />
video strategies that maximize<br />
revenue and viewer engagement<br />
across all connected screens.<br />
GLOBAL VIDEO INDEX: <strong>2012</strong> YEAR IN REVIEW 15