

Ooyala Global Video Index: 2012 Year in Review
Ooyala Global Video Index: 2012 Year in Review
Ooyala Global Video Index: 2012 Year in Review

Create successful ePaper yourself
Turn your PDF publications into a flip-book with our unique Google optimized e-Paper software.
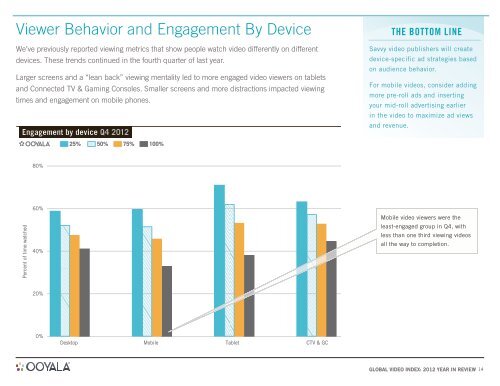
Viewer Behavior and Engagement By Device<br />
We’ve previously reported view<strong>in</strong>g metrics that show people watch video differently on different<br />
devices. These trends cont<strong>in</strong>ued <strong>in</strong> the fourth quarter of last year.<br />
Larger screens and a “lean back” view<strong>in</strong>g mentality led to more engaged video viewers on tablets<br />
and Connected TV & Gam<strong>in</strong>g Consoles. Smaller screens and more distractions impacted view<strong>in</strong>g<br />
times and engagement on mobile phones.<br />
Engagement by device Q4 <strong>2012</strong><br />
Percent of time watched<br />
80%<br />
60%<br />
40%<br />
20%<br />
0%<br />
Desktop<br />
25% 50% 75% 100%<br />
Mobile<br />
Tablet<br />
CTV & GC<br />
the Bottom l<strong>in</strong>e<br />
Savvy video publishers will create<br />
device-specific ad strategies based<br />
on audience behavior.<br />
For mobile videos, consider add<strong>in</strong>g<br />
more pre-roll ads and <strong>in</strong>sert<strong>in</strong>g<br />
your mid-roll advertis<strong>in</strong>g earlier<br />
<strong>in</strong> the video to maximize ad views<br />
and revenue.<br />
Mobile video viewers were the<br />
least-engaged group <strong>in</strong> Q4, with<br />
less than one third view<strong>in</strong>g videos<br />
all the way to completion.<br />
GLOBAL VIDEO INDEX: <strong>2012</strong> YEAR IN REVIEW 14