Journal of Technical Analysis - Market Technicians Association
Journal of Technical Analysis - Market Technicians Association
Journal of Technical Analysis - Market Technicians Association
You also want an ePaper? Increase the reach of your titles
YUMPU automatically turns print PDFs into web optimized ePapers that Google loves.
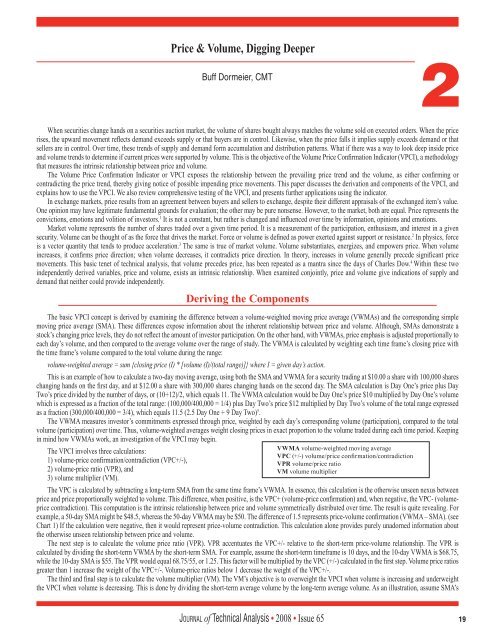
Price & Volume, Digging Deeper<br />
Buff Dormeier, CMT<br />
2<br />
When securities change hands on a securities auction market, the volume <strong>of</strong> shares bought always matches the volume sold on executed orders. When the price<br />
rises, the upward movement reflects demand exceeds supply or that buyers are in control. Likewise, when the price falls it implies supply exceeds demand or that<br />
sellers are in control. Over time, these trends <strong>of</strong> supply and demand form accumulation and distribution patterns. What if there was a way to look deep inside price<br />
and volume trends to determine if current prices were supported by volume. This is the objective <strong>of</strong> the Volume Price Confirmation Indicator (VPCI), a methodology<br />
that measures the intrinsic relationship between price and volume.<br />
The Volume Price Confirmation Indicator or VPCI exposes the relationship between the prevailing price trend and the volume, as either confirming or<br />
contradicting the price trend, thereby giving notice <strong>of</strong> possible impending price movements. This paper discusses the derivation and components <strong>of</strong> the VPCI, and<br />
explains how to use the VPCI. We also review comprehensive testing <strong>of</strong> the VPCI, and presents further applications using the indicator.<br />
In exchange markets, price results from an agreement between buyers and sellers to exchange, despite their different appraisals <strong>of</strong> the exchanged item’s value.<br />
One opinion may have legitimate fundamental grounds for evaluation; the other may be pure nonsense. However, to the market, both are equal. Price represents the<br />
convictions, emotions and volition <strong>of</strong> investors. 1 It is not a constant, but rather is changed and influenced over time by information, opinions and emotions.<br />
<strong>Market</strong> volume represents the number <strong>of</strong> shares traded over a given time period. It is a measurement <strong>of</strong> the participation, enthusiasm, and interest in a given<br />
security. Volume can be thought <strong>of</strong> as the force that drives the market. Force or volume is defined as power exerted against support or resistance. 2 In physics, force<br />
is a vector quantity that tends to produce acceleration. 3 The same is true <strong>of</strong> market volume. Volume substantiates, energizes, and empowers price. When volume<br />
increases, it confirms price direction; when volume decreases, it contradicts price direction. In theory, increases in volume generally precede significant price<br />
movements. This basic tenet <strong>of</strong> technical analysis, that volume precedes price, has been repeated as a mantra since the days <strong>of</strong> Charles Dow. 4 Within these two<br />
independently derived variables, price and volume, exists an intrinsic relationship. When examined conjointly, price and volume give indications <strong>of</strong> supply and<br />
demand that neither could provide independently.<br />
The basic VPCI concept is derived by examining the difference between a volume-weighted moving price average (VWMAs) and the corresponding simple<br />
moving price average (SMA). These differences expose information about the inherent relationship between price and volume. Although, SMAs demonstrate a<br />
stock’s changing price levels, they do not reflect the amount <strong>of</strong> investor participation. On the other hand, with VWMAs, price emphasis is adjusted proportionally to<br />
each day’s volume, and then compared to the average volume over the range <strong>of</strong> study. The VWMA is calculated by weighting each time frame’s closing price with<br />
the time frame’s volume compared to the total volume during the range:<br />
volume-weighted average = sum {closing price (I) * [volume (I)/(total range)]} where I = given day’s action.<br />
This is an example <strong>of</strong> how to calculate a two-day moving average, using both the SMA and VWMA for a security trading at $10.00 a share with 100,000 shares<br />
changing hands on the first day, and at $12.00 a share with 300,000 shares changing hands on the second day. The SMA calculation is Day One’s price plus Day<br />
Two’s price divided by the number <strong>of</strong> days, or (10+12)/2, which equals 11. The VWMA calculation would be Day One’s price $10 multiplied by Day One’s volume<br />
which is expressed as a fraction <strong>of</strong> the total range: (100,000/400,000 = 1/4) plus Day Two’s price $12 multiplied by Day Two’s volume <strong>of</strong> the total range expressed<br />
as a fraction (300,000/400,000 = 3/4), which equals 11.5 (2.5 Day One + 9 Day Two) 5 .<br />
The VWMA measures investor’s commitments expressed through price, weighted by each day’s corresponding volume (participation), compared to the total<br />
volume (participation) over time. Thus, volume-weighted averages weight closing prices in exact proportion to the volume traded during each time period. Keeping<br />
in mind how VWMAs work, an investigation <strong>of</strong> the VPCI may begin.<br />
The VPCI involves three calculations:<br />
1) volume-price confirmation/contradiction (VPC+/-),<br />
2) volume-price ratio (VPR), and<br />
3) volume multiplier (VM).<br />
Deriving the Components<br />
VWMA volume-weighted moving average<br />
VPC (+/-) volume/price confirmation/contradiction<br />
VPR volume/price ratio<br />
VM volume multiplier<br />
The VPC is calculated by subtracting a long-term SMA from the same time frame’s VWMA. In essence, this calculation is the otherwise unseen nexus between<br />
price and price proportionally weighted to volume. This difference, when positive, is the VPC+ (volume-price confirmation) and, when negative, the VPC- (volumeprice<br />
contradiction). This computation is the intrinsic relationship between price and volume symmetrically distributed over time. The result is quite revealing. For<br />
example, a 50-day SMA might be $48.5, whereas the 50-day VWMA may be $50. The difference <strong>of</strong> 1.5 represents price-volume confirmation (VWMA – SMA). (see<br />
Chart 1) If the calculation were negative, then it would represent price-volume contradiction. This calculation alone provides purely unadorned information about<br />
the otherwise unseen relationship between price and volume.<br />
The next step is to calculate the volume price ratio (VPR). VPR accentuates the VPC+/- relative to the short-term price-volume relationship. The VPR is<br />
calculated by dividing the short-term VWMA by the short-term SMA. For example, assume the short-term timeframe is 10 days, and the 10-day VWMA is $68.75,<br />
while the 10-day SMA is $55. The VPR would equal 68.75/55, or 1.25. This factor will be multiplied by the VPC (+/-) calculated in the first step. Volume price ratios<br />
greater than 1 increase the weight <strong>of</strong> the VPC+/-. Volume-price ratios below 1 decrease the weight <strong>of</strong> the VPC+/-.<br />
The third and final step is to calculate the volume multiplier (VM). The VM’s objective is to overweight the VPCI when volume is increasing and underweight<br />
the VPCI when volume is decreasing. This is done by dividing the short-term average volume by the long-term average volume. As an illustration, assume SMA’s<br />
Jo u r n a l <strong>of</strong> <strong>Technical</strong> <strong>Analysis</strong> • 2008 • Issue 65 19


