

Journal of Technical Analysis - Market Technicians Association
Journal of Technical Analysis - Market Technicians Association
Journal of Technical Analysis - Market Technicians Association

Create successful ePaper yourself
Turn your PDF publications into a flip-book with our unique Google optimized e-Paper software.
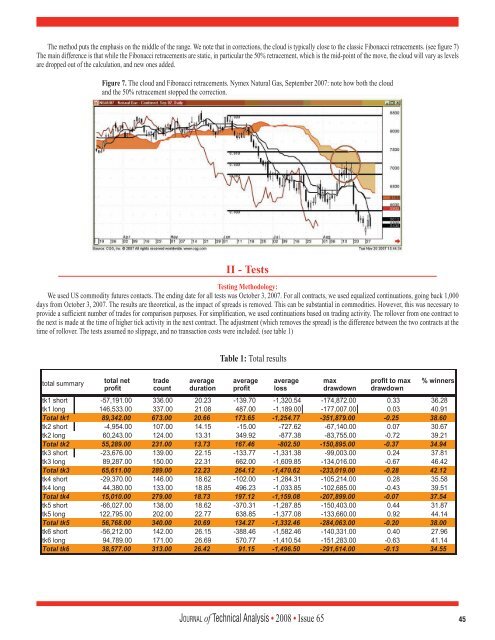
The method puts the emphasis on the middle <strong>of</strong> the range. We note that in corrections, the cloud is typically close to the classic Fibonacci retracements. (see figure 7)<br />
The main difference is that while the Fibonacci retracements are static, in particular the 50% retracement, which is the mid-point <strong>of</strong> the move, the cloud will vary as levels<br />
are dropped out <strong>of</strong> the calculation, and new ones added.<br />
Figure 7. The cloud and Fibonacci retracements. Nymex Natural Gas, September 2007: note how both the cloud<br />
and the 50% retracement stopped the correction.<br />
II - Tests<br />
Testing Methodology:<br />
We used US commodity futures contacts. The ending date for all tests was October 3, 2007. For all contracts, we used equalized continuations, going back 1,000<br />
days from October 3, 2007. The results are theoretical, as the impact <strong>of</strong> spreads is removed. This can be substantial in commodities. However, this was necessary to<br />
provide a sufficient number <strong>of</strong> trades for comparison purposes. For simplification, we used continuations based on trading activity. The rollover from one contract to<br />
the next is made at the time <strong>of</strong> higher tick activity in the next contract. The adjustment (which removes the spread) is the difference between the two contracts at the<br />
time <strong>of</strong> rollover. The tests assumed no slippage, and no transaction costs were included. (see table 1)<br />
Table 1: Total results<br />
Jo u r n a l <strong>of</strong> <strong>Technical</strong> <strong>Analysis</strong> • 2008 • Issue 65 45


