

Journal of Technical Analysis - Market Technicians Association
Journal of Technical Analysis - Market Technicians Association
Journal of Technical Analysis - Market Technicians Association

Create successful ePaper yourself
Turn your PDF publications into a flip-book with our unique Google optimized e-Paper software.
An Empirical Study <strong>of</strong> Rotational Trading Using the %b Oscillator<br />
H. Parker Evans, CFA, CFP, CMT<br />
Introduction<br />
4<br />
Academic finance is replete with studies supporting or denying the existence <strong>of</strong> serial correlation in securities prices. 1 In effect, such studies test the weak form<br />
efficient market hypothesis (EMH). Simply put, can investors use technical analysis to beat the market?<br />
Before an attempt is made to answer that question, it is necessary to define “the market.” For the purposes <strong>of</strong> this paper, “the market” is the constituent stocks<br />
<strong>of</strong> the S&P 500 Index. The S&P 500 Index, after all, is probably the most widely recognized market proxy and in practice, investors index billions <strong>of</strong> dollars to it.<br />
S&P 500 stocks are liquid and extensively researched by a multitude <strong>of</strong> technical and fundamental analysts. Consequently, one might expect that these stocks would<br />
represent a highly efficient segment <strong>of</strong> the stock market.<br />
Bollinger Bands and the %b Oscillator<br />
The %b Oscillator is a technical indictor derived from the well-known, popular Bollinger Bands indicator. “Bollinger Bands are a technical trading tool created<br />
by John Bollinger in the early 1980s. They arose from the need for adaptive trading bands and the observation that volatility was dynamic, not static as was widely<br />
believed at the time.” 2 Bollinger bands are moving average envelopes typically plotted two standard deviations above and below a moving average <strong>of</strong> price closes. In<br />
an end-<strong>of</strong>-day price chart, %b plots as an oscillator, measuring the closing price in relation to its upper and lower Bollinger Band. An analogous technical indicator<br />
is the raw stochastic %K oscillator. 3 Raw %K measures the closing price relative to the high and low price <strong>of</strong> a trading range <strong>of</strong> specified length. By definition, %K<br />
oscillates between 0 and 100. Zero means the stock closed at the low <strong>of</strong> the trading range, 100 means the stock closed at the high. Likewise for %b, except that on<br />
rare occasions a stock can close with %b below 0 or above 100, representing a two-sigma event. Conceptually, %b numerically identifies the closing stock price<br />
relative to its volatility-adjusted trading range.<br />
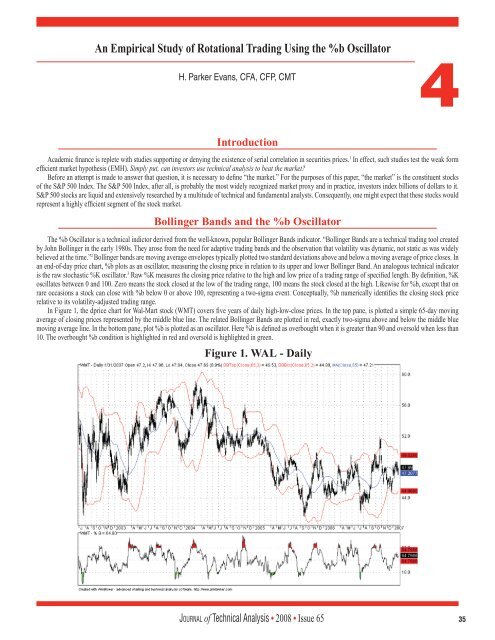
In Figure 1, the dprice chart for Wal-Mart stock (WMT) covers five years <strong>of</strong> daily high-low-close prices. In the top pane, is plotted a simple 65-day moving<br />
average <strong>of</strong> closing prices represented by the middle blue line. The related Bollinger Bands are plotted in red, exactly two-sigma above and below the middle blue<br />
moving average line. In the bottom pane, plot %b is plotted as an oscillator. Here %b is defined as overbought when it is greater than 90 and oversold when less than<br />
10. The overbought %b condition is highlighted in red and oversold is highlighted in green.<br />
Figure 1. WAL - Daily<br />
Jo u r n a l <strong>of</strong> <strong>Technical</strong> <strong>Analysis</strong> • 2008 • Issue 65 35


