

Journal of Technical Analysis - Market Technicians Association
Journal of Technical Analysis - Market Technicians Association
Journal of Technical Analysis - Market Technicians Association

You also want an ePaper? Increase the reach of your titles
YUMPU automatically turns print PDFs into web optimized ePapers that Google loves.
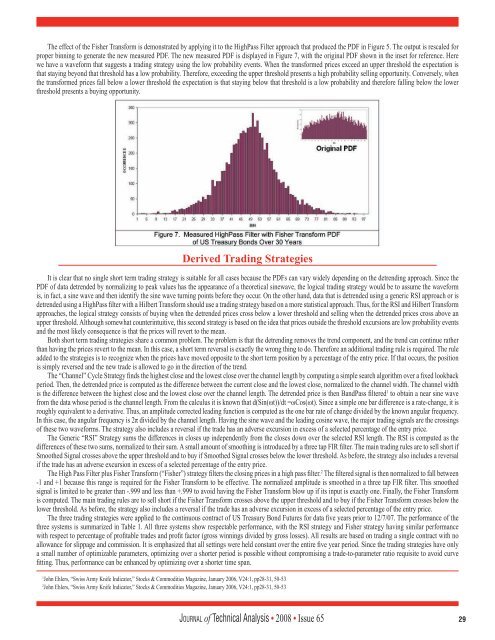
The effect <strong>of</strong> the Fisher Transform is demonstrated by applying it to the HighPass Filter approach that produced the PDF in Figure 5. The output is rescaled for<br />
proper binning to generate the new measured PDF. The new measured PDF is displayed in Figure 7, with the original PDF shown in the inset for reference. Here<br />
we have a waveform that suggests a trading strategy using the low probability events. When the transformed prices exceed an upper threshold the expectation is<br />
that staying beyond that threshold has a low probability. Therefore, exceeding the upper threshold presents a high probability selling opportunity. Conversely, when<br />
the transformed prices fall below a lower threshold the expectation is that staying below that threshold is a low probability and therefore falling below the lower<br />
threshold presents a buying opportunity.<br />
Derived Trading Strategies<br />
It is clear that no single short term trading strategy is suitable for all cases because the PDFs can vary widely depending on the detrending approach. Since the<br />
PDF <strong>of</strong> data detrended by normalizing to peak values has the appearance <strong>of</strong> a theoretical sinewave, the logical trading strategy would be to assume the waveform<br />
is, in fact, a sine wave and then identify the sine wave turning points before they occur. On the other hand, data that is detrended using a generic RSI approach or is<br />
detrended using a HighPass filter with a Hilbert Transform should use a trading strategy based on a more statistical approach. Thus, for the RSI and Hilbert Transform<br />
approaches, the logical strategy consists <strong>of</strong> buying when the detrended prices cross below a lower threshold and selling when the detrended prices cross above an<br />
upper threshold. Although somewhat counterintuitive, this second strategy is based on the idea that prices outside the threshold excursions are low probability events<br />
and the most likely consequence is that the prices will revert to the mean.<br />
Both short term trading strategies share a common problem. The problem is that the detrending removes the trend component, and the trend can continue rather<br />
than having the prices revert to the mean. In this case, a short term reversal is exactly the wrong thing to do. Therefore an additional trading rule is required. The rule<br />
added to the strategies is to recognize when the prices have moved opposite to the short term position by a percentage <strong>of</strong> the entry price. If that occurs, the position<br />
is simply reversed and the new trade is allowed to go in the direction <strong>of</strong> the trend.<br />
The “Channel” Cycle Strategy finds the highest close and the lowest close over the channel length by computing a simple search algorithm over a fixed lookback<br />
period. Then, the detrended price is computed as the difference between the current close and the lowest close, normalized to the channel width. The channel width<br />
is the difference between the highest close and the lowest close over the channel length. The detrended price is then BandPass filtered 1 to obtain a near sine wave<br />
from the data whose period is the channel length. From the calculus it is known that d(Sin(ωt))/dt =ωCos(ωt). Since a simple one bar difference is a rate-change, it is<br />
roughly equivalent to a derivative. Thus, an amplitude corrected leading function is computed as the one bar rate <strong>of</strong> change divided by the known angular frequency.<br />
In this case, the angular frequency is 2π divided by the channel length. Having the sine wave and the leading cosine wave, the major trading signals are the crossings<br />
<strong>of</strong> these two waveforms. The strategy also includes a reversal if the trade has an adverse excursion in excess <strong>of</strong> a selected percentage <strong>of</strong> the entry price.<br />
The Generic “RSI” Strategy sums the differences in closes up independently from the closes down over the selected RSI length. The RSI is computed as the<br />
differences <strong>of</strong> these two sums, normalized to their sum. A small amount <strong>of</strong> smoothing is introduced by a three tap FIR filter. The main trading rules are to sell short if<br />
Smoothed Signal crosses above the upper threshold and to buy if Smoothed Signal crosses below the lower threshold. As before, the strategy also includes a reversal<br />
if the trade has an adverse excursion in excess <strong>of</strong> a selected percentage <strong>of</strong> the entry price.<br />
The High Pass Filter plus Fisher Transform (“Fisher”) strategy filters the closing prices in a high pass filter. 2 The filtered signal is then normalized to fall between<br />
-1 and +1 because this range is required for the Fisher Transform to be effective. The normalized amplitude is smoothed in a three tap FIR filter. This smoothed<br />
signal is limited to be greater than -.999 and less than +.999 to avoid having the Fisher Transform blow up if its input is exactly one. Finally, the Fisher Transform<br />
is computed. The main trading rules are to sell short if the Fisher Transform crosses above the upper threshold and to buy if the Fisher Transform crosses below the<br />
lower threshold. As before, the strategy also includes a reversal if the trade has an adverse excursion in excess <strong>of</strong> a selected percentage <strong>of</strong> the entry price.<br />
The three trading strategies were applied to the continuous contract <strong>of</strong> US Treasury Bond Futures for data five years prior to 12/7/07. The performance <strong>of</strong> the<br />
three systems is summarized in Table 1. All three systems show respectable performance, with the RSI strategy and Fisher strategy having similar performance<br />
with respect to percentage <strong>of</strong> pr<strong>of</strong>itable trades and pr<strong>of</strong>it factor (gross winnings divided by gross losses). All results are based on trading a single contract with no<br />
allowance for slippage and commission. It is emphasized that all settings were held constant over the entire five year period. Since the trading strategies have only<br />
a small number <strong>of</strong> optimizable parameters, optimizing over a shorter period is possible without compromising a trade-to-parameter ratio requisite to avoid curve<br />
fitting. Thus, performance can be enhanced by optimizing over a shorter time span.<br />
1 John Ehlers, “Swiss Army Knife Indicator,” Stocks & Commodities Magazine, January 2006, V24:1, pp28-31, 50-53<br />
2 John Ehlers, “Swiss Army Knife Indicator,” Stocks & Commodities Magazine, January 2006, V24:1, pp28-31, 50-53<br />
Jo u r n a l <strong>of</strong> <strong>Technical</strong> <strong>Analysis</strong> • 2008 • Issue 65 29


