

Journal of Technical Analysis - Market Technicians Association
Journal of Technical Analysis - Market Technicians Association
Journal of Technical Analysis - Market Technicians Association

Create successful ePaper yourself
Turn your PDF publications into a flip-book with our unique Google optimized e-Paper software.
Confirming Signals<br />
Several VPCI signals may be employed in conjunction with price trends and price indicators. These include a VPCI greater than zero, which shows whether he<br />
relationship between price trends and volume confirms or contradicts the price trend. 6 More importantly, a rising or falling VPCI, provides the trend direction <strong>of</strong> the<br />
VPCI, revealing the direction <strong>of</strong> confirmation or contradiction. And a smoothed volume-weighted average <strong>of</strong> VPCI called “VPCI smoothed” demonstrates how much<br />
the VPCI has changed from previous VPCI levels, and is used to indicate momentum. Bollinger Bands 7 maybe also applied to the VPCI, exposing VPCI extremes.<br />
Fundamentally, the VPCI reveals the proportional imbalances between price trends and volume-adjusted price trends. An uptrend with increasing volume is<br />
a market characterized by greed supported by the fuel needed to grow. An uptrend without volume is complacent and reveals greed deprived <strong>of</strong> the fuel needed to<br />
sustain itself. Investors without the influx <strong>of</strong> other investors (volume) will eventually lose interest and the uptrend should eventually breakdown.<br />
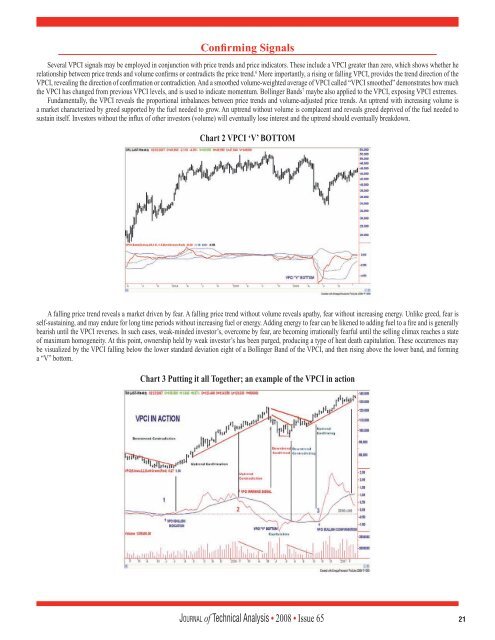
Chart 2 VPCI ‘V’ BOTTOM<br />
A falling price trend reveals a market driven by fear. A falling price trend without volume reveals apathy, fear without increasing energy. Unlike greed, fear is<br />
self-sustaining, and may endure for long time periods without increasing fuel or energy. Adding energy to fear can be likened to adding fuel to a fire and is generally<br />
bearish until the VPCI reverses. In such cases, weak-minded investor’s, overcome by fear, are becoming irrationally fearful until the selling climax reaches a state<br />
<strong>of</strong> maximum homogeneity. At this point, ownership held by weak investor’s has been purged, producing a type <strong>of</strong> heat death capitulation. These occurrences may<br />
be visualized by the VPCI falling below the lower standard deviation eight <strong>of</strong> a Bollinger Band <strong>of</strong> the VPCI, and then rising above the lower band, and forming<br />
a “V” bottom.<br />
Chart 3 Putting it all Together; an example <strong>of</strong> the VPCI in action<br />
Jo u r n a l <strong>of</strong> <strong>Technical</strong> <strong>Analysis</strong> • 2008 • Issue 65 21


