

Journal of Technical Analysis - Market Technicians Association
Journal of Technical Analysis - Market Technicians Association
Journal of Technical Analysis - Market Technicians Association

You also want an ePaper? Increase the reach of your titles
YUMPU automatically turns print PDFs into web optimized ePapers that Google loves.
20<br />
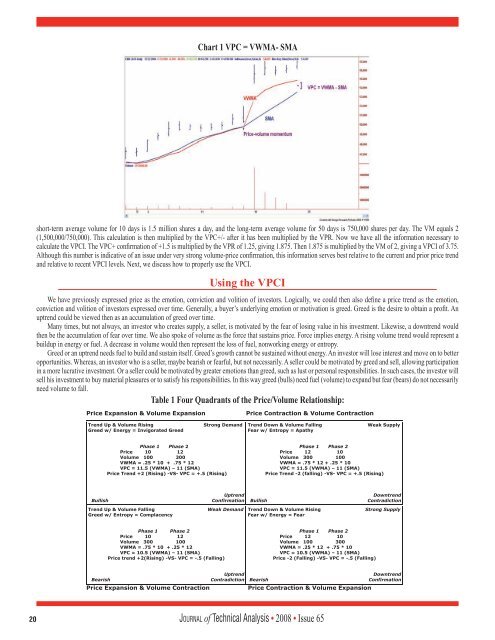
Chart 1 VPC = VWMA- SMA<br />
short-term average volume for 10 days is 1.5 million shares a day, and the long-term average volume for 50 days is 750,000 shares per day. The VM equals 2<br />
(1,500,000/750,000). This calculation is then multiplied by the VPC+/- after it has been multiplied by the VPR. Now we have all the information necessary to<br />
calculate the VPCI. The VPC+ confirmation <strong>of</strong> +1.5 is multiplied by the VPR <strong>of</strong> 1.25, giving 1.875. Then 1.875 is multiplied by the VM <strong>of</strong> 2, giving a VPCI <strong>of</strong> 3.75.<br />
Although this number is indicative <strong>of</strong> an issue under very strong volume-price confirmation, this information serves best relative to the current and prior price trend<br />
and relative to recent VPCI levels. Next, we discuss how to properly use the VPCI.<br />
Using the VPCI<br />
We have previously expressed price as the emotion, conviction and volition <strong>of</strong> investors. Logically, we could then also define a price trend as the emotion,<br />
conviction and volition <strong>of</strong> investors expressed over time. Generally, a buyer’s underlying emotion or motivation is greed. Greed is the desire to obtain a pr<strong>of</strong>it. An<br />
uptrend could be viewed then as an accumulation <strong>of</strong> greed over time.<br />
Many times, but not always, an investor who creates supply, a seller, is motivated by the fear <strong>of</strong> losing value in his investment. Likewise, a downtrend would<br />
then be the accumulation <strong>of</strong> fear over time. We also spoke <strong>of</strong> volume as the force that sustains price. Force implies energy. A rising volume trend would represent a<br />
buildup in energy or fuel. A decrease in volume would then represent the loss <strong>of</strong> fuel, nonworking energy or entropy.<br />
Greed or an uptrend needs fuel to build and sustain itself. Greed’s growth cannot be sustained without energy. An investor will lose interest and move on to better<br />
opportunities. Whereas, an investor who is a seller, maybe bearish or fearful, but not necessarily. A seller could be motivated by greed and sell, allowing participation<br />
in a more lucrative investment. Or a seller could be motivated by greater emotions than greed, such as lust or personal responsibilities. In such cases, the investor will<br />
sell his investment to buy material pleasures or to satisfy his responsibilities. In this way greed (bulls) need fuel (volume) to expand but fear (bears) do not necessarily<br />
need volume to fall.<br />
Table 1 Four Quadrants <strong>of</strong> the Price/Volume Relationship:<br />
Jo u r n a l <strong>of</strong> <strong>Technical</strong> <strong>Analysis</strong> • 2008 • Issue 65


