

Journal of Technical Analysis - Market Technicians Association
Journal of Technical Analysis - Market Technicians Association
Journal of Technical Analysis - Market Technicians Association

Create successful ePaper yourself
Turn your PDF publications into a flip-book with our unique Google optimized e-Paper software.
36<br />
Rotational Trading<br />
Rotational trading is a method <strong>of</strong> using rank-ordered asset lists to construct investment portfolios. For example, both Value Line and Zacks Investment Research<br />
<strong>of</strong>fer well-known research products featuring proprietary stock timeliness rankings. These services assign a rank, one to five, to each asset in their coverage universe.<br />
Using these rankings, a rotational system might buy stocks ranked #1, sell when they drop below rank #2, and rotate those proceeds back into stocks ranked #1. For<br />
many years, Investor’s Business Daily has published proprietary relative strength rankings for stocks ranging from one to ninety-nine. Such increased granularity is<br />
useful for active rotational trading, as will be demonstrated further on.<br />
As always, a complete trading system must address position sizing and answer: What percentage risk <strong>of</strong> total portfolio equity can be exposed on any given<br />
trade or asset?<br />
Portfolio Selection Using Relative %b<br />
The basis for using %b as a momentum oscillator stems from the empirical observation that extreme price excursions have a tendency for mean reversion,<br />
i.e. possible negative serial correlation. In <strong>Technical</strong> <strong>Analysis</strong> Explained (Pring, Martin J., McGraw-Hill, 2002), Martin Pring warned against relying solely on<br />
momentum oscillators when analyzing individual securities. “Momentum signals should always be used in conjunction with a trend reversal signal by the actual<br />
price.” This paper will test the opposite idea within a portfolio context. We will boldly buy weakness and sell strength without waiting for evidence <strong>of</strong> a reversal<br />
in price. To mix metaphors, the strategy will systematically “catch the falling knife” and sell the “dead cat” bounce without regard to any other technical indicator.<br />
Specifically the trading algorithm will buy stocks with the very lowest %b ranks and sell when they increase rank relative to other stocks. Understand that a portfolio<br />
<strong>of</strong> stocks will be bought that have the lowest %b relative to all other stocks in a specified selection universe.<br />
In <strong>Technical</strong> <strong>Analysis</strong> from A to Z (Achelis, Steven B. Chicago: Irwin, 1995), John Bollinger states, “When prices move outside the bands, a continuation <strong>of</strong> the<br />
current trend is implied.” Because a reasonable observer could interpret this rule as a contradiction to what we propose to test, we will also consider what happens<br />
if we reverse our trading rule, buying strong stocks with the very highest %b (presumably stocks “outside the band”) and selling only when they drop in rank.<br />
Now to answer the original question, by using the %b oscillator coupled with rotational trading rules, we can select stock portfolios that beat the risk-adjusted<br />
return <strong>of</strong> the S&P 500 index. We report empirical evidence supporting this thesis later in the results section <strong>of</strong> this paper. In addition, an important purpose <strong>of</strong> this<br />
paper is to provide sufficient detail to allow other analysts to replicate our (back-tested) results and to modify or adapt our methods if desired. That detail comes next<br />
in the methods and materials section <strong>of</strong> this paper.<br />
Methods & Materials<br />
Sample Selection<br />
Acquiring an appropriate sample for back testing proved daunting. Initially we ran some preliminary back tests <strong>of</strong> our proposed %b indicator on a sample<br />
consisting <strong>of</strong> those stocks in the S&P 500 as <strong>of</strong> February 2007. This back test generated very impressive results from 1990 forward. In fact, the results seemed too<br />
good to be true. We realized that other analysts could justifiably criticize the backtest sample as suffering from survivor bias 4 and look-ahead bias. 5 Look-ahead<br />
bias results from using information in a backtest that was unknown during the period analyzed. Clearly, investors in 1990 had no way to know what stocks would<br />
constitute the S&P 500 in 2007. Survivor bias results when a study fails to account for stocks that have ceased trading due to mergers, acquisitions or bankruptcies.<br />
Survivor bias also results when for other reasons an index selection committee deletes and replaces a constituent.<br />
What we wanted for our sample was the full history <strong>of</strong> closing quotes for all stocks that were in the S&P 500 from 1990-2006 during the time those stocks were<br />
in the index, including the non-surviving stocks. We were unable to acquire that sample. Instead, we created a sample selection universe using the following protocol.<br />
Our sample contains end-<strong>of</strong>-day-prices for seventeen years, 1990-2006, on S&P 500 constituent stocks. From 1990-1997 we included only stocks that were on the<br />
January 1990 S&P 500 constituent list. From 1998-2006 we included prices for all stocks on the January 1998 constituent list. Starting in 2004 for the period 2004-<br />
2006, we added all prices for all stocks appearing on the January 2004 constituent list. For all spans and the full period, we included prices <strong>of</strong> non-surviving stocks<br />
up to the date that they ceased trading. Our sample contains 815 stocks, 490 <strong>of</strong> which were trading at year-end 2006.<br />
S<strong>of</strong>tware Tools and Data Services<br />
We downloaded constituent lists for the S&P 500 and prices for inactive, non-surviving stock from the Bloomberg Pr<strong>of</strong>essional Terminal. We downloaded<br />
surviving stock price histories from Yahoo Finance. We primarily used Amibroker 6 , a popular technical analysis and charting s<strong>of</strong>tware application, and the Amibroker<br />
Formula Language to design and test trading strategies and indicators. We used also Micros<strong>of</strong>t Excel for various purposes in our study.<br />
Variables, Trading Algorithm, Code<br />
We tested a system based on 65-trading-day (three months) %b against our sample selection universe.<br />
At the close <strong>of</strong> every trading day over the test period, our trading algorithm ranked all stocks from highest<br />
to lowest according to %b score. On the first trading day, January 2, 1990, the trading algorithm bought the<br />
40 lowest ranked stocks, investing 2.5% <strong>of</strong> portfolio equity in each stock. Once purchased, the algorithm<br />
held any given stock until it moved up and out <strong>of</strong> the ranks <strong>of</strong> the 80 lowest ranked stocks. At that point,<br />
the algorithm sold the stock and rotated the proceeds back into one <strong>of</strong> the 40 lowest ranked stocks not<br />
already held. The back test ended December 31, 2006. The algorithm recorded trade executions at the<br />
closing price the next day after order entry. The algorithm continued to execute this rotational trading<br />
every trading day <strong>of</strong> the 17-year back test period. At the time <strong>of</strong> purchase, the amount invested in any<br />
stock purchase could not exceed 2.5% <strong>of</strong> current portfolio equity but could be less if available cash was<br />
less than 2.5%. There was no rule forcing rebalancing <strong>of</strong> existing positions. The system traded long only,<br />
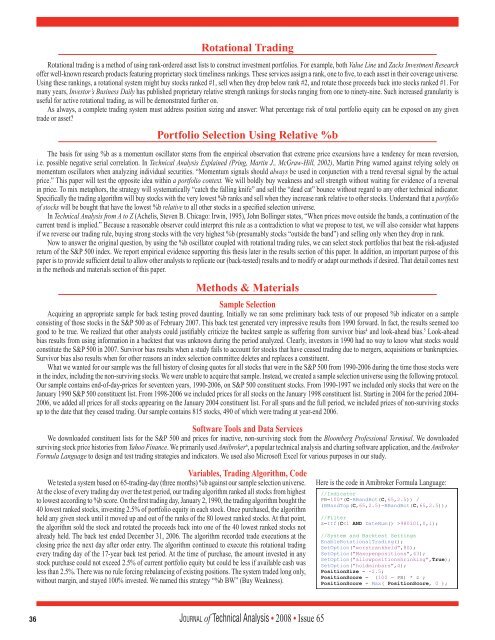
without margin, and stayed 100% invested. We named this strategy “%b BW” (Buy Weakness).<br />
Jo u r n a l <strong>of</strong> <strong>Technical</strong> <strong>Analysis</strong> • 2008 • Issue 65<br />
Here is the code in Amibroker Formula Language:


