

Journal of Technical Analysis - Market Technicians Association
Journal of Technical Analysis - Market Technicians Association
Journal of Technical Analysis - Market Technicians Association

Create successful ePaper yourself
Turn your PDF publications into a flip-book with our unique Google optimized e-Paper software.
The Boundaries <strong>of</strong> <strong>Technical</strong> <strong>Analysis</strong><br />
Milton W. Berg, CFA<br />
<strong>Market</strong> Prognostication<br />
1<br />
In his treatise on stock market patterns, the late Pr<strong>of</strong>essor Harry V. Roberts 1 observed that “<strong>of</strong> all economic time series, the history <strong>of</strong> stock prices, both individual<br />
and aggregate, has probably been most widely and intensively studied,” and “patterns <strong>of</strong> technical analysis may be little if nothing more than a statistical artifact.” 2<br />
Ibbotson and Sinquefield maintain that historical stock price data cannot be used to predict daily, weekly or monthly percent changes in the market averages.<br />
However, they do claim the ability to predict in advance the probability that the market will move between +X% and -Y% over a specific period. 3 Only to this very<br />
limited extent – forecasting the probabilities <strong>of</strong> return – can historical stock price movements be considered indicative <strong>of</strong> future price movements.<br />
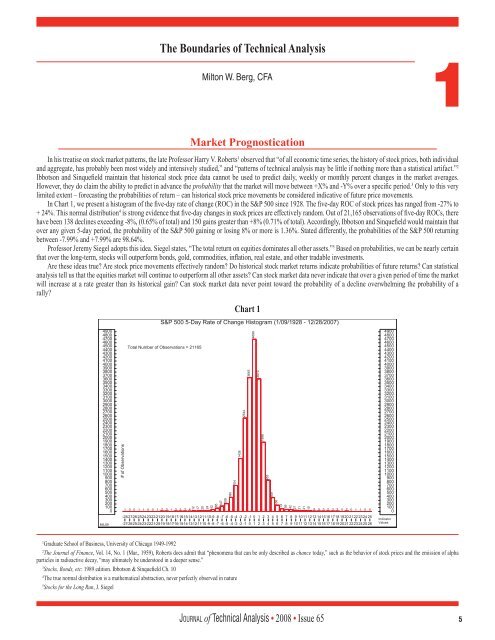
In Chart 1, we present a histogram <strong>of</strong> the five-day rate <strong>of</strong> change (ROC) in the S&P 500 since 1928. The five-day ROC <strong>of</strong> stock prices has ranged from -27% to<br />
+ 24%. This normal distribution 4 is strong evidence that five-day changes in stock prices are effectively random. Out <strong>of</strong> 21,165 observations <strong>of</strong> five-day ROCs, there<br />
have been 138 declines exceeding -8%, (0.65% <strong>of</strong> total) and 150 gains greater than +8% (0.71% <strong>of</strong> total). Accordingly, Ibbotson and Sinquefield would maintain that<br />
over any given 5-day period, the probability <strong>of</strong> the S&P 500 gaining or losing 8% or more is 1.36%. Stated differently, the probabilities <strong>of</strong> the S&P 500 returning<br />
between -7.99% and +7.99% are 98.64%.<br />
Pr<strong>of</strong>essor Jeremy Siegel adopts this idea. Siegel states, “The total return on equities dominates all other assets.” 5 Based on probabilities, we can be nearly certain<br />
that over the long-term, stocks will outperform bonds, gold, commodities, inflation, real estate, and other tradable investments.<br />
Are these ideas true? Are stock price movements effectively random? Do historical stock market returns indicate probabilities <strong>of</strong> future returns? Can statistical<br />
analysis tell us that the equities market will continue to outperform all other assets? Can stock market data never indicate that over a given period <strong>of</strong> time the market<br />
will increase at a rate greater than its historical gain? Can stock market data never point toward the probability <strong>of</strong> a decline overwhelming the probability <strong>of</strong> a<br />
rally?<br />
1 Graduate School <strong>of</strong> Business, University <strong>of</strong> Chicago 1949-1992<br />
Chart 1<br />
2 The <strong>Journal</strong> <strong>of</strong> Finance, Vol. 14, No. 1 (Mar., 1959), Roberts does admit that “phenomena that can be only described as chance today,” such as the behavior <strong>of</strong> stock prices and the emission <strong>of</strong> alpha<br />
particles in radioactive decay, “may ultimately be understood in a deeper sense.”<br />
3 Stocks, Bonds, etc: 1989 edition. Ibbotson & Sinquefield Ch. 10<br />
4 The true normal distribution is a mathematical abstraction, never perfectly observed in nature<br />
5 Stocks for the Long Run, J. Siegel<br />
Jo u r n a l <strong>of</strong> <strong>Technical</strong> <strong>Analysis</strong> • 2008 • Issue 65 5


