

Journal of Technical Analysis - Market Technicians Association
Journal of Technical Analysis - Market Technicians Association
Journal of Technical Analysis - Market Technicians Association

You also want an ePaper? Increase the reach of your titles
YUMPU automatically turns print PDFs into web optimized ePapers that Google loves.
28<br />
Because the turning points have relatively low probability an alternate strategy can be inferred. The idea is to buy when the detrended price crosses below a<br />
threshold near the lower bound in anticipation <strong>of</strong> the prices reversing to higher probability territory. Similarly, the strategy would sell when the detrended price<br />
crosses above a threshold near the upper bound. Note that this is not the same as using classical 30/70 or 20/80 thresholds for signals with the RSI because signal is<br />
not waiting for confirmation crossing back across the thresholds. Here we are anticipating a reversal to a higher probability occurrence – we expect a reversion to<br />
normalcy. Using this anticipatory method in the case <strong>of</strong> a classic indicator such as the Stochastic oscillator can be costly because the Stochastic can easily remain at<br />
the extreme excursion point (or “rail” in engineering parlance) for long periods <strong>of</strong> time.<br />
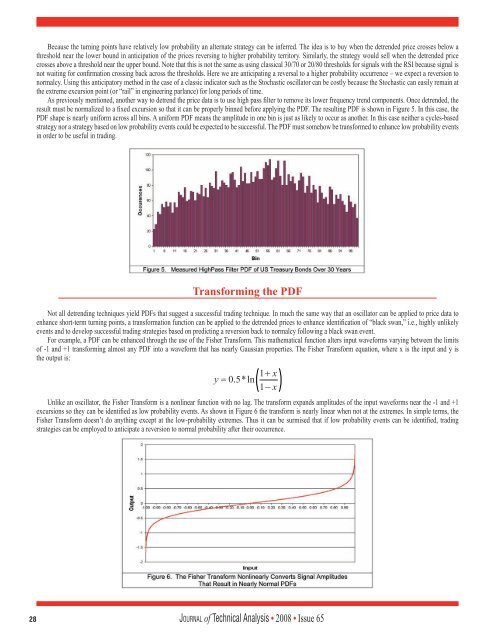
As previously mentioned, another way to detrend the price data is to use high pass filter to remove its lower frequency trend components. Once detrended, the<br />
result must be normalized to a fixed excursion so that it can be properly binned before applying the PDF. The resulting PDF is shown in Figure 5. In this case, the<br />
PDF shape is nearly uniform across all bins. A uniform PDF means the amplitude in one bin is just as likely to occur as another. In this case neither a cycles-based<br />
strategy nor a strategy based on low probability events could be expected to be successful. The PDF must somehow be transformed to enhance low probability events<br />
in order to be useful in trading.<br />
Transforming the PDF<br />
Not all detrending techniques yield PDFs that suggest a successful trading technique. In much the same way that an oscillator can be applied to price data to<br />
enhance short-term turning points, a transformation function can be applied to the detrended prices to enhance identification <strong>of</strong> “black swan,” i.e., highly unlikely<br />
events and to develop successful trading strategies based on predicting a reversion back to normalcy following a black swan event.<br />
For example, a PDF can be enhanced through the use <strong>of</strong> the Fisher Transform. This mathematical function alters input waveforms varying between the limits<br />
<strong>of</strong> -1 and +1 transforming almost any PDF into a waveform that has nearly Gaussian properties. The Fisher Transform equation, where x is the input and y is<br />
the output is:<br />
Unlike an oscillator, the Fisher Transform is a nonlinear function with no lag. The transform expands amplitudes <strong>of</strong> the input waveforms near the -1 and +1<br />
excursions so they can be identified as low probability events. As shown in Figure 6 the transform is nearly linear when not at the extremes. In simple terms, the<br />
Fisher Transform doesn’t do anything except at the low-probability extremes. Thus it can be surmised that if low probability events can be identified, trading<br />
strategies can be employed to anticipate a reversion to normal probability after their occurrence.<br />
Jo u r n a l <strong>of</strong> <strong>Technical</strong> <strong>Analysis</strong> • 2008 • Issue 65


