

Journal of Technical Analysis - Market Technicians Association
Journal of Technical Analysis - Market Technicians Association
Journal of Technical Analysis - Market Technicians Association

You also want an ePaper? Increase the reach of your titles
YUMPU automatically turns print PDFs into web optimized ePapers that Google loves.
Pr<strong>of</strong>itability <strong>of</strong> Various Style Index Momentum Strategies<br />
To analyze the performance <strong>of</strong> style index momentum based trading strategies, we rank the style indexes based on formation period performance, then buy the<br />
top performing index and short the bottom performing index. The long top minus short bottom (Long-Short) position is then held for the designated holding period.<br />
Exhibit 1 reports the average monthly returns to Long-Short portfolios across various portfolio formation and holding periods.<br />
Results are generally positive and statistically significant, especially for the shorter holding periods. Long-Short returns across various formation periods peak at<br />
12 months <strong>of</strong> prior performance. Across various holding periods the Long-Short returns peak at 1 month. Therefore, top performing Long-Short portfolio was 12,1<br />
with an average monthly return <strong>of</strong> 0.85% (p-value < 1%). Based on these results, the remainder <strong>of</strong> the paper focuses on portfolios composed <strong>of</strong> one style index with<br />
a 12 month formation and one month holding period. While this 12,1 portfolio was the highest performer for the 34 year period, when various time periods were<br />
analyzed it was not always the top performer 4 . However, the top performing strategy was consistently driven by medium-term momentum with prior performance in<br />
the 8 to 14 month range.<br />
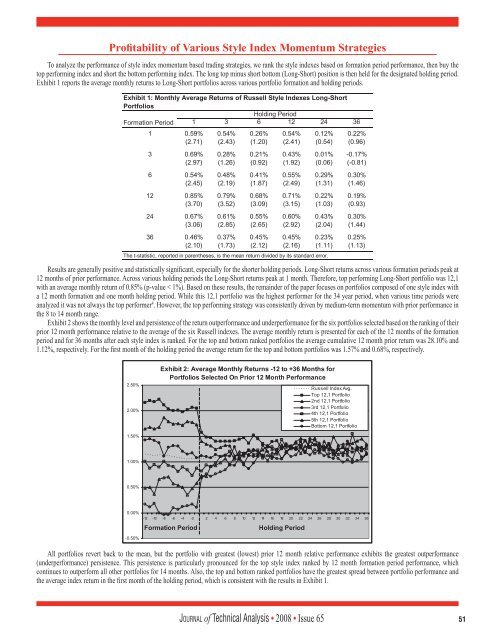
Exhibit 2 shows the monthly level and persistence <strong>of</strong> the return outperformance and underperformance for the six portfolios selected based on the ranking <strong>of</strong> their<br />
prior 12 month performance relative to the average <strong>of</strong> the six Russell indexes. The average monthly return is presented for each <strong>of</strong> the 12 months <strong>of</strong> the formation<br />
period and for 36 months after each style index is ranked. For the top and bottom ranked portfolios the average cumulative 12 month prior return was 28.10% and<br />
1.12%, respectively. For the first month <strong>of</strong> the holding period the average return for the top and bottom portfolios was 1.57% and 0.68%, respectively.<br />
All portfolios revert back to the mean, but the portfolio with greatest (lowest) prior 12 month relative performance exhibits the greatest outperformance<br />
(underperformance) persistence. This persistence is particularly pronounced for the top style index ranked by 12 month formation period performance, which<br />
continues to outperform all other portfolios for 14 months. Also, the top and bottom ranked portfolios have the greatest spread between portfolio performance and<br />
the average index return in the first month <strong>of</strong> the holding period, which is consistent with the results in Exhibit 1.<br />
Jo u r n a l <strong>of</strong> <strong>Technical</strong> <strong>Analysis</strong> • 2008 • Issue 65 51


