ANNUAL REPORT 2011 - IFAD
ANNUAL REPORT 2011 - IFAD
ANNUAL REPORT 2011 - IFAD

You also want an ePaper? Increase the reach of your titles
YUMPU automatically turns print PDFs into web optimized ePapers that Google loves.
Appendix D<br />
Table 1<br />
Asset class and investment policy weights (<strong>IFAD</strong>-only)<br />
As at 31 December <strong>2011</strong> and 2010<br />
Investment<br />
Asset class Portfolio<br />
Millions of<br />
policy<br />
<strong>2011</strong><br />
Short-term<br />
% US dollars %<br />
liquidity 8.1 199.9 5.5<br />
Held-to-maturity<br />
Government<br />
15.6 383.9 15.6<br />
bonds<br />
Diversified fixed-<br />
38.7 950.5 43.5<br />
income 16.9 413.9 15.4<br />
Inflation-linked 20.7 507.3 20.0<br />
Total 100.0 2 455.5 100.0<br />
Asset class Portfolio<br />
Millions of<br />
Investment<br />
policy<br />
2010<br />
Short-term<br />
% US dollars %<br />
liquidity 7.2 182.6 5.5<br />
Held-to-maturity<br />
Government<br />
15.8 397.7 15.8<br />
bonds<br />
Diversified fixed-<br />
40.2 1 013.7 43.5<br />
income 17.6 444.2 15.2<br />
Inflation-linked 19.2 484.6 20.0<br />
Total 100.0 2 522.8 100.0<br />
Each asset class is managed according to its own<br />
investment guidelines. The guidelines address a variety of<br />
market risks through restrictions on eligibility of instruments<br />
and on managers’ activity by setting:<br />
1. Pre-assigned benchmarks and limits on deviations from<br />
benchmarks in terms of tacking error limits<br />
2. Credit floors (please refer to (h) credit risk).<br />
The benchmark indices used for the respective portfolios<br />
are shown in table 2.<br />
Table 2<br />
Benchmark indices by portfolio<br />
Portfolio Benchmark index<br />
Short-term Not applicable<br />
liquidity<br />
Government<br />
bonds<br />
Diversified fixedincome<br />
JP Morgan Global Government Bond<br />
Index (1-3 years), customized to the<br />
four component currencies of the SDR<br />
valuation basket<br />
Barclays U.S. Aggregate Index (Aa+ or<br />
above) and Barclays U.S. Aggregate<br />
Index (Aa+ or above) excluding ABS<br />
and CMBS<br />
Inflation-linked Barclays Capital World Government<br />
Inflation-Linked Index (1-10 years)<br />
Held-to-maturity Equally-weighted extended sector<br />
benchmark (internally calculated on a<br />
quarterly basis)<br />
Note: ABS - asset-backed securities; CMBS – commercial<br />
mortgage-backed securities<br />
Exposure to market risk is adjusted by modifying the<br />
duration of the portfolio, depending on the outlook for<br />
changes in securities market prices.<br />
The upper limit for the duration is set at:<br />
One year above the benchmark for the global<br />
government bonds asset class.<br />
Two years above the benchmark for the diversified<br />
fixed-interest asset class.<br />
Two years above the benchmark for the inflation-linked<br />
bonds asset class.<br />
The average duration of <strong>IFAD</strong>’s investment portfolio at 31<br />
December <strong>2011</strong> and 2010 and respective benchmarks are<br />
shown in table 3.<br />
12<br />
Table 3<br />
Average duration of portfolios and benchmarks in years<br />
(<strong>IFAD</strong>-only)<br />
As at 31 December <strong>2011</strong> and 2010<br />
Portfolio Benchmark<br />
Portfolio <strong>2011</strong> 2010 <strong>2011</strong> 2010<br />
Short-term<br />
liquidity - - - -<br />
Government<br />
bonds 1.8 1.7 2.0 1.8<br />
Diversified<br />
fixedinterest<br />
4.6 4.4 4.4 4.6<br />
Inflationlinked<br />
6.0 2.9 5.1 5.0<br />
Held-tomaturity<br />
2.3 2.3 2.3 2.3<br />
Total<br />
average 2.6 3.1 2.5 3.7<br />
The sensitivity analysis of <strong>IFAD</strong>’s overall investment portfolio<br />
in table 4 shows how a parallel shift in the yield curve (-300<br />
to +300 basis points) would affect the value of the<br />
investment portfolio as at 31 December <strong>2011</strong>.<br />
Table 4<br />
Sensitivity analysis on investment portfolio (<strong>IFAD</strong>-only)<br />
<strong>2011</strong> 2010<br />
Basis<br />
point<br />
shift in<br />
yield<br />
curve<br />
Change in<br />
value of<br />
externally<br />
managed<br />
portfolio<br />
(US$<br />
million)<br />
Total<br />
portfolio<br />
(US$<br />
million)<br />
Change in<br />
value of<br />
externally<br />
managed<br />
portfolio<br />
(US$<br />
million)<br />
Total<br />
portfolio<br />
(US$<br />
million<br />
-300 196 2 652 159 2 681<br />
-250 164 2 619 132 2 654<br />
-200 131 2 586 106 2 628<br />
-150 98 2 554 79 2 602<br />
-100 65 2 521 53 2 575<br />
-50 33 2 488 26 2 549<br />
0 - 2 456 - 2 522<br />
50 (33) 2 423 (26) 2 496<br />
100 (65) 2 390 (53) 2 469<br />
150 (98) 2 357 (79) 2 443<br />
200 (131) 2 325 (106) 2 417<br />
250 (164) 2 292 (132) 2 390<br />
300 (196) 2 259 (159) 2 364<br />
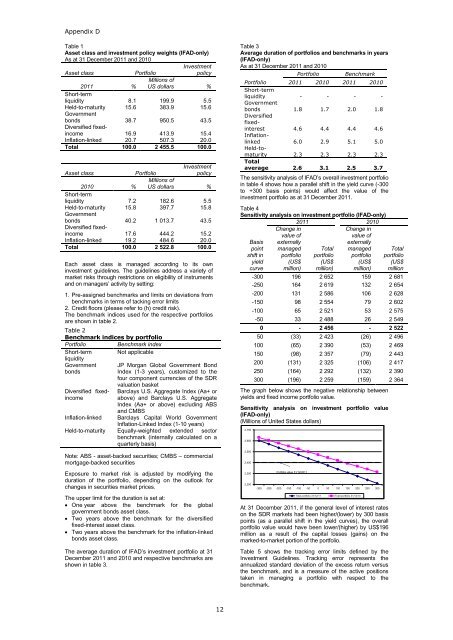
The graph below shows the negative relationship between<br />
yields and fixed income portfolio value.<br />
Sensitivity analysis on investment portfolio value<br />
(<strong>IFAD</strong>-only)<br />
(Millions of United States dollars)<br />
2,750<br />
2,650<br />
2,550<br />
2,450<br />
2,350<br />
2,250<br />
Portfolio value 31/12/<strong>2011</strong><br />
-300 -250 -200 -150 -100 -50 0 50 100 150 200 250 300<br />
Total portfolio 31/12/11 Total portfolio 31/12/10<br />
At 31 December <strong>2011</strong>, if the general level of interest rates<br />
on the SDR markets had been higher/(lower) by 300 basis<br />
points (as a parallel shift in the yield curves), the overall<br />
portfolio value would have been lower/(higher) by US$196<br />
million as a result of the capital losses (gains) on the<br />
marked-to-market portion of the portfolio.<br />
Table 5 shows the tracking error limits defined by the<br />
Investment Guidelines. Tracking error represents the<br />
annualized standard deviation of the excess return versus<br />
the benchmark, and is a measure of the active positions<br />
taken in managing a portfolio with respect to the<br />
benchmark.