- Page 1 and 2:
452 / Space Network Project 450-SNU
- Page 3 and 4:
Space Network Users’ Guide (SNUG)
- Page 5 and 6:
Preface The Space Network Users’
- Page 7 and 8:
Change Information Page List of Eff
- Page 9 and 10:
Table of Contents Section 1. Introd
- Page 11 and 12:
6.2.5 Real-Time Configuration Chang
- Page 13 and 14:
Appendix B. Functional Configuratio
- Page 15 and 16:
Appendix J. Customer Constraints fo
- Page 17 and 18:
Figure 10-5. NCCDS/NEST Scheduling
- Page 19 and 20:
Figure B-6. Customer Platform Funct
- Page 21 and 22:
NASA Standard Transponder .........
- Page 23 and 24:
Table B-3. Data Configuration Const
- Page 25 and 26:
1.1 Purpose and Scope Section 1. In
- Page 27 and 28:
Section/ Appendix Table 1-1. Docume
- Page 29 and 30:
S SN Future Services Describes futu
- Page 31 and 32:
Many of the links require access to
- Page 33 and 34:
Revision 10 1-9 450-SNUG https://co
- Page 35 and 36:
Section 2. SN Overview 2.1 General
- Page 37 and 38:
Revision 10 2-3 450-SNUG Customer P
- Page 39 and 40:
Multiple Access Antenna • 30 elem
- Page 41 and 42:
Table 2-1. Example of TDRS Constell
- Page 43 and 44:
services. The detailed TDRS spacecr
- Page 45 and 46:
Average Coverage (%) 100 95 90 85 8
- Page 47 and 48:
quality. For further information on
- Page 49 and 50:
3.1 General Section 3. Services Ava
- Page 51 and 52:
Revision 10 3-3 450-SNUG MA (note 1
- Page 53 and 54:
Table 3-2 provides an overview of t
- Page 55 and 56:
Revision 10 3-7 450-SNUG TDRS G/T (
- Page 57 and 58:
Data Group and Mode (note 4) Table
- Page 59 and 60:
platforms to have SA support on one
- Page 61 and 62:
a TDRS. Compatibility testing is pe
- Page 63 and 64:
NASA-unique 4800 bit block and then
- Page 65 and 66:
Revision 10 3-17 450-SNUG Table 3-4
- Page 67 and 68:
Revision 10 3-19 450-SNUG Table 3-4
- Page 69 and 70:
the Space Network's ability to supp
- Page 71 and 72:
4.1 Overview Section 4. Obtaining S
- Page 73 and 74:
5.1 General Section 5. MA Telecommu
- Page 75 and 76:
an appropriate forward service has
- Page 77 and 78:
Table 5-1. TDRSS MA Forward PSK Ser
- Page 79 and 80:
NOTE: Customers who operate in a SS
- Page 81 and 82:
Table 5-3. Salient Characteristics
- Page 83 and 84:
e. The customer platform receiving
- Page 85 and 86:
DG1 (note 1) Table 5-6. TDRSS MA Re
- Page 87 and 88:
Table 5-6. TDRSS MA Return Service
- Page 89 and 90:
Revision 10 5-17 450-SNUG Table 5-7
- Page 91 and 92:
platform transmit frequency for non
- Page 93 and 94:
configurations, the I-Q channel amb
- Page 95 and 96:
Table 5-8. TDRSS MA Return Service
- Page 97 and 98:
Acquisition (note 3) (cont’d): Ta
- Page 99 and 100:
d. After symbol/decoder and symbol/
- Page 101 and 102:
Section 3, paragraph 3.5 for guidel
- Page 103 and 104:
5.3.3.4 Reacquisition While in the
- Page 105 and 106:
5.3.5 Acquisition Scenarios The fol
- Page 107 and 108:
d. DG2 Mode Transitions. 1. DG2 non
- Page 109 and 110:
Table 5-11. TDRSS MA Return Service
- Page 111 and 112:
Table 5-11. TDRSS MA Return Service
- Page 113 and 114:
Table 5-11. TDRSS MA Return Service
- Page 115 and 116:
6.1 General Section 6. SSA Telecomm
- Page 117 and 118:
6.2.2 PSK Signal Parameters The TDR
- Page 119 and 120:
Table 6-1. TDRSS SSA Forward PSK Se
- Page 121 and 122:
6.2.2.2 BPSK Signal Parameters a. B
- Page 123 and 124:
unless the customer is utilizing th
- Page 125 and 126:
Table 6-2. TDRSS SSA Forward Phase
- Page 127 and 128:
Table 6-3. TDRSS SSA Forward Servic
- Page 129 and 130:
Table 6-4. Salient Characteristics
- Page 131 and 132:
d. The customer platform receiving
- Page 133 and 134:
DG1 (note 1) Table 6-7. TDRSS SSA R
- Page 135 and 136:
Table 6-7. TDRSS SSA Return Service
- Page 137 and 138:
6.3.2.2 DG1 Signal Parameters DG1 s
- Page 139 and 140:
Revision 10 6-25 450-SNUG Table 6-8
- Page 141 and 142:
and signal characteristics specifie
- Page 143 and 144:
Table 6-9. TDRSS SSA Return Service
- Page 145 and 146:
Table 6-9. TDRSS SSA Return Service
- Page 147 and 148:
3. Balanced Power Single Data Sourc
- Page 149 and 150:
and an ephemeris uncertainty as def
- Page 151 and 152:
Table 6-11. SSA Return Service Real
- Page 153 and 154:
2. DG1 Mode 1 (or 3) to DG1 Mode 2
- Page 155 and 156:
Table 6-12. TDRSS SSA Return Servic
- Page 157 and 158:
Table 6-12. TDRSS SSA Return Servic
- Page 159 and 160:
Table 6-12. TDRSS SSA Return Servic
- Page 161 and 162:
service is supported through TDRS F
- Page 163 and 164:
Table 6-14. TDRS SSAR IF Service Sp
- Page 165 and 166:
7.1 General Section 7. KuSA Telecom
- Page 167 and 168:
c. Frequency Sweep on the Forward L
- Page 169 and 170:
Table 7-1. TDRSS KuSA Forward Servi
- Page 171 and 172:
Table 7-1. TDRSS KuSA Forward Servi
- Page 173 and 174:
7.2.5 Acquisition Scenarios The fol
- Page 175 and 176:
Table 7-2. TDRSS KuSA Forward Servi
- Page 177 and 178:
Table 7-4. KuSA Forward Service Rea
- Page 179 and 180:
Table 7-5. TDRSS KuSA Return Servic
- Page 181 and 182:
. SQPSK Modulation. SQPSK modulatio
- Page 183 and 184:
7.3.2.3 DG2 Signal Parameters DG2 s
- Page 185 and 186:
Revision 10 7-21 450-SNUG Dual Data
- Page 187 and 188:
code and carrier acquisition will b
- Page 189 and 190:
Revision 10 7-25 450-SNUG Table 7-7
- Page 191 and 192:
Revision 10 7-27 450-SNUG Table 7-7
- Page 193 and 194:
Revision 10 7-29 450-SNUG Table 7-7
- Page 195 and 196:
identical data) having unbalanced I
- Page 197 and 198:
acquisition, the process should tra
- Page 199 and 200:
Table 7-8. KuSA Return Service Real
- Page 201 and 202:
egins) or by its customer platform
- Page 203 and 204:
Reconfiguration and reacquisition b
- Page 205 and 206:
Table 7-9. TDRSS KuSA Return Servic
- Page 207 and 208:
Table 7-9. TDRSS KuSA Return Servic
- Page 209 and 210:
7.3.6 225 MHz IF Service This secti
- Page 211 and 212:
Table 7-11. TDRS KuSAR IF Service S
- Page 213 and 214:
7.3.6.3 Potential Signal Performanc
- Page 215 and 216:
Revision 10 7-51 450-SNUG Table 7-1
- Page 217 and 218:
8.1 General Section 8. KaSA Telecom
- Page 219 and 220:
8.2 KaSA Forward Services 8.2.1 Gen
- Page 221 and 222:
Table 8-1. TDRSS KaSA Forward Servi
- Page 223 and 224:
c. Asynchronous Data Modulation. Fo
- Page 225 and 226:
Table 8-2. TDRSS KaSA Forward Servi
- Page 227 and 228:
Table 8-3. Salient Characteristics
- Page 229 and 230:
in Table 8-1. The EIRP directed tow
- Page 231 and 232:
Table 8-5. TDRSS KaSA Return 225 MH
- Page 233 and 234:
Single Data Source Dual Data Source
- Page 235 and 236:
Revision 10 8-19 450-SNUG Table 8-7
- Page 237 and 238:
Revision 10 8-21 450-SNUG Acquisiti
- Page 239 and 240:
Revision 10 8-23 450-SNUG Table 8-7
- Page 241 and 242:
8.3.3.2 Bit Error Rate (BER) Table
- Page 243 and 244:
d. Loss of Autotrack. Loss of autot
- Page 245 and 246:
Table 8-8. KaSA Return Service Real
- Page 247 and 248:
noncoherent transmissions are desir
- Page 249 and 250:
Table 8-9. TDRSS KaSA Return 225 MH
- Page 251 and 252:
Changes to the operating conditions
- Page 253 and 254:
Table 8-11. TDRS KaSAR 225 MHz and
- Page 255 and 256:
Revision 10 8-39 450-SNUG Table 8-1
- Page 257 and 258:
Revision 10 8-41 450-SNUG Table 8-1
- Page 259 and 260:
Section 9. Tracking and Clock Calib
- Page 261 and 262:
(sample-to-sample) range data as in
- Page 263 and 264:
NOTE: The definition of 240. MHz is
- Page 265 and 266:
time" refers to that portion (leadi
- Page 267 and 268:
e. TDRSS Delay Compensation. The WS
- Page 269 and 270:
Section 10. SN Operations for TDRSS
- Page 271 and 272:
Table 10-2. Overview of SN Message
- Page 273 and 274:
10.2.2.6 Schedule Distribution List
- Page 275 and 276:
Table 10-3. Schedule Request Descri
- Page 277 and 278:
Revision 10 10-9 450-SNUG Applicabl
- Page 279 and 280:
10.2.3.4 Forecast Scheduling Genera
- Page 281 and 282:
which have been committed to the SN
- Page 283 and 284:
10.2.4.2 Specific Schedule Request
- Page 285 and 286:
e. Each SSC represents a single ser
- Page 287 and 288:
NOTE: TUT reports are not transmitt
- Page 289 and 290:
Scheduling Data (SHO) Operations Me
- Page 291 and 292:
10.2.7.2 NISN Event Schedule (NES)
- Page 293 and 294:
System Element Table 10-7. Real-tim
- Page 295 and 296:
System Element Table 10-9. Real-tim
- Page 297 and 298:
System Element Table 10-10. Real-ti
- Page 299 and 300:
System Element Table 10-10. Real-ti
- Page 301 and 302:
Revision 10 10-33 450-SNUG Message
- Page 303 and 304:
Revision 10 10-35 450-SNUG Message
- Page 305 and 306:
Revision 10 10-37 450-SNUG Message
- Page 307 and 308:
Revision 10 10-39 450-SNUG Message
- Page 309 and 310:
Revision 10 10-41 450-SNUG Message
- Page 311 and 312:
Revision 10 10-43 450-SNUG Message
- Page 313 and 314:
Revision 10 10-45 450-SNUG Message
- Page 315 and 316:
10.4 Customer Platform Emergency Op
- Page 317 and 318:
operations. During a customer platf
- Page 319 and 320:
Appendix A. Example Link Calculatio
- Page 321 and 322:
A.3.2 Forward service link calculat
- Page 323 and 324:
User Spacecraft G/T (dB/K) 20 10 0
- Page 325 and 326:
User Spacecraft G/T (dB/K) 50 40 30
- Page 327 and 328:
User Spacecraft G/T (dB/K) 50 40 30
- Page 329 and 330:
. Required Eb /No is 9.9 dB (BER of
- Page 331 and 332:
Ideal Required Prec (dBWi) -150 -16
- Page 333 and 334:
Ideal Required Prec (dBWi) -150 -16
- Page 335 and 336:
Ideal Required Prec (dBWi) -150 -16
- Page 337 and 338:
Ideal Required Prec (dBWi) -150 -16
- Page 339 and 340:
Ideal Required Prec (dBWi) -150 -16
- Page 341 and 342:
Ideal Required Prec (dBWi) -150 -16
- Page 343 and 344:
Ideal Required Prec (dBWi) -150 -16
- Page 345 and 346:
Ideal Required Prec (dBWi) -160 -17
- Page 347 and 348:
Ideal Required Prec (dBWi) -150 -16
- Page 349 and 350:
Ideal Required Prec (dBWi) -140 -15
- Page 351 and 352:
Ideal Required Prec (dBWi) -150 -16
- Page 353 and 354:
Ideal Required Prec (dBWi) -140 -15
- Page 355 and 356:
Ideal Required Prec (dBWi) -150 -16
- Page 357 and 358:
Ideal Required Prec (dBWi) -140 -15
- Page 359 and 360:
Ideal Required Prec (dBWi) -150 -16
- Page 361 and 362:
Ideal Required Prec (dBWi) -150 -16
- Page 363 and 364:
Ideal Required Prec (dBWi) -150 -16
- Page 365 and 366:
Ideal Required Prec (dBWi) -150 -16
- Page 367 and 368:
Appendix B. Functional Configuratio
- Page 369 and 370:
Customer MOC SN Data Interface WDIS
- Page 371 and 372:
Revision 10 B-5 450-SNUG SN Ground
- Page 373 and 374:
Revision 10 B-7 450-SNUG SN Ground
- Page 375 and 376: The SN return services are divided
- Page 377 and 378: Revision 10 B-11 450-SNUG From chan
- Page 379 and 380: Revision 10 B-13 450-SNUG From sing
- Page 381 and 382: Revision 10 B-15 450-SNUG NRZ Only
- Page 383 and 384: Revision 10 B-17 450-SNUG Table B-3
- Page 385 and 386: The signal is transmitted using unb
- Page 387 and 388: Table B-5. Data Configuration Const
- Page 389 and 390: Table B-7. Data Configuration Const
- Page 391 and 392: Appendix C. Operational Aspects of
- Page 393 and 394: service PN codes (command and range
- Page 395 and 396: Revision 10 C-5 450-SNUG Table C-1.
- Page 397 and 398: Revision 10 C-7 450-SNUG Table C-3.
- Page 399 and 400: Revision 10 C-9 450-SNUG Table C-3.
- Page 401 and 402: Revision 10 C-11 450-SNUG Table C-3
- Page 403 and 404: Revision 10 C-13 450-SNUG Table C-3
- Page 405 and 406: C.4 Reacquisition C.4.1 Introductio
- Page 407 and 408: Table C-4. Parameters Which Impact
- Page 409 and 410: Customer MOC/NCCDS changes operatin
- Page 411 and 412: . Initial acquisition not achieved
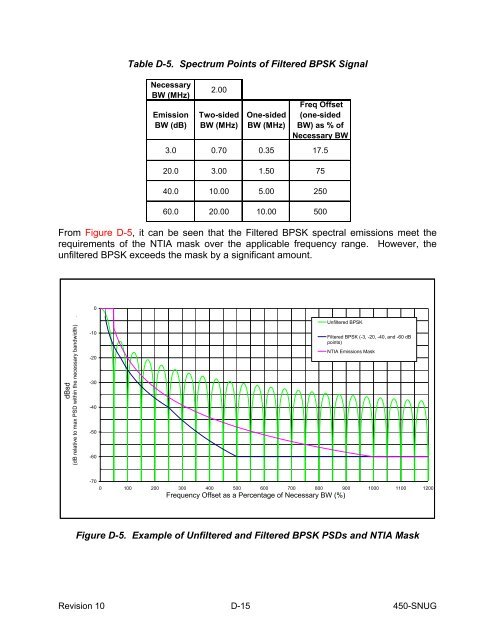
- Page 413 and 414: Appendix D. Spectrum Considerations
- Page 415 and 416: For most Space Network users, the a
- Page 417 and 418: PFD (α) = maximum power flux densi
- Page 419 and 420: Equation D-5: sin 4 ( x) P T , / 2
- Page 421 and 422: For signals with two channels, the
- Page 423 and 424: PFD (dBW/m^2/4kHz) -142 -144 -146 -
- Page 425: Figure D-4. NTIA Out-of-Band (OOB)
- Page 429 and 430: criteria for deep space operations
- Page 431 and 432: PSD (dBW/Hz) -170 -180 -190 -200 -2
- Page 433 and 434: potential interference to other sys
- Page 435 and 436: Annex to Appendix D D.A.1 Special C
- Page 437 and 438: Table D.A-1. Peak Power Calculation
- Page 439 and 440: Appendix E. Customer Platform and T
- Page 441 and 442: 1. Jitter = None (Coded or Uncoded
- Page 443 and 444: Figure E-8. QPSK Phase Imbalance id
- Page 445 and 446: R max R ideal Figure E-11. Residual
- Page 447 and 448: For forward service: O/ OUT AM / PM
- Page 449 and 450: E.16 Out-of-Band Emissions Out-of-b
- Page 451 and 452: E.21 PN Chip Rate PN code chip rate
- Page 453 and 454: Appendix F. Periodic Convolutional
- Page 455 and 456: Revision 10 F-3 450-SNUG ENCODER SY
- Page 457 and 458: Appendix G. Predicted Performance D
- Page 459 and 460: G.3.3 If the RFI environment become
- Page 461 and 462: G.6 SSA and MA Forward Service RFI
- Page 463 and 464: Appendix H. Demand Access System (D
- Page 465 and 466: H.1.4 DAS Service Modes There are t
- Page 467 and 468: DAS provides service through each s
- Page 469 and 470: modulation format. Acquisition by D
- Page 471 and 472: H.1.5.3 Transmission Delays The ove
- Page 473 and 474: Receiving service request responses
- Page 475 and 476: Revision 10 H-13 450-SNUG Customer
- Page 477 and 478:
H.3.2 Communications Interface H.3.
- Page 479 and 480:
Upon determining that the request i
- Page 481 and 482:
Appendix I. NASA Integrated Service
- Page 483 and 484:
Figure I-1. NISN/SN Legacy Interfac
- Page 485 and 486:
I.2.2 Non-IP Routed Data Services P
- Page 487 and 488:
Network Control Header Customer Hea
- Page 489 and 490:
NOTE: A block with bit 82 set to bi
- Page 491 and 492:
Appendix J. Customer Constraints fo
- Page 493 and 494:
J.3 Acquisition For S-band DG2 nonc
- Page 495 and 496:
Appendix K. Use of Reed-Solomon Cod
- Page 497 and 498:
NOTE: Throughout this document, the
- Page 499 and 500:
Appendix L. McMurdo TDRSS Relay Sys
- Page 501 and 502:
Appendix M. Deleted This page inten
- Page 503 and 504:
N.3 Test Services Description Test
- Page 505 and 506:
TDRSS component may require the who
- Page 507 and 508:
N.6.2 Test Scheduling The use of al
- Page 509 and 510:
This page intentionally left blank.
- Page 511 and 512:
model also determined duty cycles f
- Page 513 and 514:
This page intentionally left blank.
- Page 515 and 516:
P.1 Major System Components P.1.1 C
- Page 517 and 518:
P.2 External Interfaces P.2.1 Netwo
- Page 519 and 520:
The user will be able to print eith
- Page 521 and 522:
SNAS MOC user will be able to speci
- Page 523 and 524:
The SNAS will allow a minimum durat
- Page 525 and 526:
the DAS Resource Allocation Request
- Page 527 and 528:
gateway and a proxy for the Closed
- Page 529 and 530:
Figure Q-1. WDISC Overview Q.2.1 IP
- Page 531 and 532:
database management, testing, troub
- Page 533 and 534:
In general, to obtain SN services,
- Page 535 and 536:
scheduling of SN Gateway services a
- Page 537 and 538:
Figure R-1. SN Gateway Overview Rev
- Page 539 and 540:
Figure R-3. WSC SN Gateway Interfac
- Page 541 and 542:
Table R-1. Comparison of Between WD
- Page 543 and 544:
Table S-1. TDRSS Forward Service Si
- Page 545 and 546:
Service Modulation Coding (2) Data
- Page 547 and 548:
Service Data Group DG2 (5) Phase Mo
- Page 549 and 550:
Service Data Group Mode Modulation
- Page 551 and 552:
This page intentionally left blank.
- Page 553 and 554:
Command Data Telemetry Data Ground
- Page 555 and 556:
And Data Handling (C&DH), referred
- Page 557 and 558:
This page intentionally left blank.
- Page 559 and 560:
Table U-1. TDRSS MAR Service Recomm
- Page 561 and 562:
Table U-2. TDRSS SSAR Service Recom
- Page 563 and 564:
This page intentionally left blank.
- Page 565 and 566:
BSR bit slippage rate BW bandwidth
- Page 567 and 568:
EET End-to-End Test EIF Engineering
- Page 569 and 570:
IRAC Interdepartmental Radio Adviso
- Page 571 and 572:
NASCOM NASA Communications Network
- Page 573 and 574:
R R range acceleration between a T
- Page 575 and 576:
SND Space Network Directive SNG SN
- Page 577:
T s receiving system noise temperat