the vascular flora of the natchez trace parkway - NPS Inventory and ...
the vascular flora of the natchez trace parkway - NPS Inventory and ...
the vascular flora of the natchez trace parkway - NPS Inventory and ...

Create successful ePaper yourself
Turn your PDF publications into a flip-book with our unique Google optimized e-Paper software.
A. Kruse 2004<br />
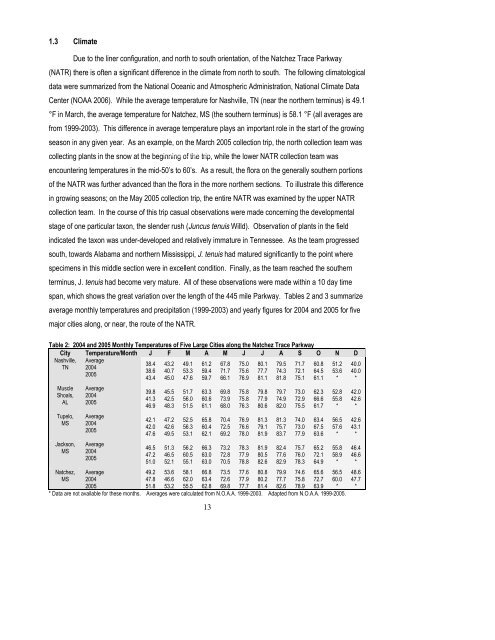
1.3 Climate<br />
Due to <strong>the</strong> liner configuration, <strong>and</strong> north to south orientation, <strong>of</strong> <strong>the</strong> Natchez Trace Parkway<br />
(NATR) <strong>the</strong>re is <strong>of</strong>ten a significant difference in <strong>the</strong> climate from north to south. The following climatological<br />
data were summarized from <strong>the</strong> National Oceanic <strong>and</strong> Atmospheric Administration, National Climate Data<br />
Center (NOAA 2006). While <strong>the</strong> average temperature for Nashville, TN (near <strong>the</strong> nor<strong>the</strong>rn terminus) is 49.1<br />
°F in March, <strong>the</strong> average temperature for Natchez, MS (<strong>the</strong> sou<strong>the</strong>rn terminus) is 58.1 °F (all averages are<br />
from 1999-2003). This difference in average temperature plays an important role in <strong>the</strong> start <strong>of</strong> <strong>the</strong> growing<br />
season in any given year. As an example, on <strong>the</strong> March 2005 collection trip, <strong>the</strong> north collection team was<br />
collecting plants in <strong>the</strong> snow at <strong>the</strong> beginning © Stephan <strong>of</strong> L. <strong>the</strong> Hatch trip, 2004<br />
while <strong>the</strong> lower NATR collection team was<br />
encountering temperatures in <strong>the</strong> mid-50’s to 60’s. As a result, <strong>the</strong> <strong>flora</strong> on <strong>the</strong> generally sou<strong>the</strong>rn portions<br />
<strong>of</strong> <strong>the</strong> NATR was fur<strong>the</strong>r advanced than <strong>the</strong> <strong>flora</strong> in <strong>the</strong> more nor<strong>the</strong>rn sections. To illustrate this difference<br />
in growing seasons; on <strong>the</strong> May 2005 collection trip, <strong>the</strong> entire NATR was examined by <strong>the</strong> upper NATR<br />
collection team. In <strong>the</strong> course <strong>of</strong> this trip casual observations were made concerning <strong>the</strong> developmental<br />
stage <strong>of</strong> one particular taxon, <strong>the</strong> slender rush (Juncus tenuis Willd). Observation <strong>of</strong> plants in <strong>the</strong> field<br />
indicated <strong>the</strong> taxon was under-developed <strong>and</strong> relatively immature in Tennessee. As <strong>the</strong> team progressed<br />
south, towards Alabama <strong>and</strong> nor<strong>the</strong>rn Mississippi, J. tenuis had matured significantly to <strong>the</strong> point where<br />
specimens in this middle section were in excellent condition. Finally, as <strong>the</strong> team reached <strong>the</strong> sou<strong>the</strong>rn<br />
terminus, J. tenuis had become very mature. All <strong>of</strong> <strong>the</strong>se observations were made within a 10 day time<br />
span, which shows <strong>the</strong> great variation over <strong>the</strong> length <strong>of</strong> <strong>the</strong> 445 mile Parkway. Tables 2 <strong>and</strong> 3 summarize<br />
average monthly temperatures <strong>and</strong> precipitation (1999-2003) <strong>and</strong> yearly figures for 2004 <strong>and</strong> 2005 for five<br />
major cities along, or near, <strong>the</strong> route <strong>of</strong> <strong>the</strong> NATR.<br />
Table 2: 2004 <strong>and</strong> 2005 Monthly Temperatures <strong>of</strong> Five Large Cities along <strong>the</strong> Natchez Trace Parkway<br />
City Temperature/Month J F M A M J J A S O N D<br />
Nashville,<br />
TN<br />
Average<br />
2004<br />
2005<br />
38.4<br />
38.6<br />
43.4<br />
43.2<br />
40.7<br />
45.0<br />
49.1<br />
53.3<br />
47.6<br />
61.2<br />
59.4<br />
59.7<br />
67.8<br />
71.7<br />
66.1<br />
75.0<br />
75.6<br />
76.9<br />
80.1<br />
77.7<br />
81.1<br />
79.5<br />
74.3<br />
81.8<br />
71.7<br />
72.1<br />
75.1<br />
60.8<br />
64.5<br />
61.1<br />
51.2<br />
53.6<br />
*<br />
40.0<br />
40.0<br />
*<br />
Muscle<br />
Shoals,<br />
AL<br />
Average<br />
2004<br />
2005<br />
39.8<br />
41.3<br />
46.9<br />
45.5<br />
42.5<br />
48.3<br />
51.7<br />
56.0<br />
51.5<br />
63.3<br />
60.6<br />
61.1<br />
69.8<br />
73.9<br />
68.0<br />
75.8<br />
75.8<br />
76.3<br />
79.8<br />
77.9<br />
80.6<br />
79.7<br />
74.9<br />
82.0<br />
73.0<br />
72.9<br />
75.5<br />
62.3<br />
66.6<br />
61.7<br />
52.8<br />
55.8<br />
*<br />
42.0<br />
42.6<br />
*<br />
Tupelo,<br />
MS<br />
Average<br />
2004<br />
2005<br />
42.1<br />
42.0<br />
47.6<br />
47.2<br />
42.6<br />
49.5<br />
52.5<br />
56.3<br />
53.1<br />
65.8<br />
60.4<br />
62.1<br />
70.4<br />
72.5<br />
69.2<br />
76.9<br />
76.6<br />
78.0<br />
81.3<br />
79.1<br />
81.9<br />
81.3<br />
75.7<br />
83.7<br />
74.0<br />
73.0<br />
77.9<br />
63.4<br />
67.5<br />
63.6<br />
56.5<br />
57.6<br />
*<br />
42.6<br />
43.1<br />
*<br />
Jackson,<br />
MS<br />
Average<br />
2004<br />
2005<br />
46.5<br />
47.2<br />
51.0<br />
51.3<br />
46.5<br />
52.1<br />
56.2<br />
60.5<br />
55.1<br />
66.3<br />
63.0<br />
63.0<br />
73.2<br />
72.8<br />
70.5<br />
78.3<br />
77.9<br />
78.8<br />
81.9<br />
80.5<br />
82.6<br />
82.4<br />
77.6<br />
82.9<br />
75.7<br />
76.0<br />
78.3<br />
65.2<br />
72.1<br />
64.9<br />
55.8<br />
58.9<br />
*<br />
46.4<br />
46.6<br />
*<br />
Natchez, Average<br />
49.2 53.6 58.1 66.8 73.5 77.6 80.8 79.9 74.6 65.6 56.5 48.6<br />
MS 2004<br />
47.8 46.6 62.0 63.4 72.6 77.9 80.2 77.7 75.8 72.7 60.0 47.7<br />
2005<br />
51.8 53.2 55.5 62.8 69.8 77.7 81.4 82.6 78.9 63.9 * *<br />
* Data are not available for <strong>the</strong>se months. Averages were calculated from N.O.A.A. 1999-2003. Adapted from N.O.A.A. 1999-2005.<br />
13