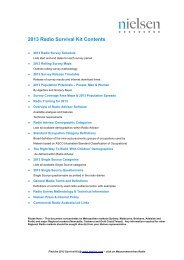
2012 Radio Survival Kit Contents - Nielsen
2012 Radio Survival Kit Contents - Nielsen
2012 Radio Survival Kit Contents - Nielsen

Create successful ePaper yourself
Turn your PDF publications into a flip-book with our unique Google optimized e-Paper software.
MELBOURNE <strong>2012</strong> - POPULATION SPREAD BY SLA<br />
Sample<br />
Sample<br />
Statistical Local Area Population 0+* % Interviewing<br />
Statistical Local Area Population 0+* % Interviewing<br />
Areas<br />
Areas<br />
1 North 3 East<br />
Banyule (C) - Heidelberg 67,013 1.5% 6 Boroondara (C) - Camberwell N. 47,030 1.1% 4<br />
Banyule (C) - North 57,236 1.3% 5 Boroondara (C) - Camberwell S. 53,691 1.2% 5<br />
Brimbank (C) - Keilor 92,974 2.1% 9 Boroondara (C) - Hawthorn 37,233 0.9% 3<br />
Darebin (C) - Northcote 51,057 1.2% 5 Boroondara (C) - Kew 31,553 0.7% 3<br />
Darebin (C) - Preston 90,082 2.1% 8 Knox (C) - North-East 66,505 1.5% 6<br />
Hume (C) - Broadmeadows 66,411 1.5% 6 Knox (C) - North-West 47,237 1.1% 4<br />
Hume (C) - Craigieburn 69,268 1.6% 6 Knox (C) - South 43,255 1.0% 4<br />
Hume (C) - Sunbury 36,317 0.8% 3 Manningham (C) - East 16,250 0.4% 1<br />
Macedon Ranges (S) - Romsey 12,048 0.3% 1 Manningham (C) - West 102,940 2.4% 10<br />
Macedon Ranges (S) Bal 21,585 0.5% 2 Maroondah (C) - Croydon 62,380 1.4% 6<br />
Mitchell (S) - South 23,744 0.5% 2 Maroondah (C) - Ringwood 44,552 1.0% 4<br />
Moonee Valley (C) - Essendon 74,176 1.7% 7 Monash (C) - Waverley East 60,663 1.4% 6<br />
Moonee Valley (C) - West 43,844 1.0% 4 Monash (C) - Waverley West 68,730 1.6% 6<br />
Moreland (C) - Brunswick 46,249 1.1% 4 Stonnington (C) - Malvern 49,092 1.1% 5<br />
Moreland (C) - Coburg 52,731 1.2% 5 Stonnington (C) - Prahran 51,259 1.2% 5<br />
Moreland (C) - North 51,858 1.2% 5 Whitehorse (C) - Box Hill 55,790 1.3% 5<br />
Nillumbik (S) - South 28,736 0.7% 3 Whitehorse (C) - Nunawading E. 47,454 1.1% 4<br />
Nillumbik (S) - South-West 25,706 0.6% 2 Whitehorse (C) - Nunawading W. 53,553 1.2% 5<br />
Nillumbik (S) Bal 9,742 0.2% 1 Yarra (C) - Richmond 28,244 0.6% 3<br />
Whittlesea (C) - North 46,800 1.1% 4 Yarra Ranges (S) - Central 15,674 0.4% 1<br />
Whittlesea (C) - South-East 44,846 1.0% 4 Yarra Ranges (S) - Dandenongs 30,802 0.7% 3<br />
Whittlesea (C) - South-West 63,467 1.4% 6 Yarra Ranges (S) - Lilydale 73,175 1.7% 7<br />
Yarra (C) - North 51,296 1.2% 5 Yarra Ranges (S) - North 13,636 0.3% 1<br />
1,127,186 25.7%<br />
103 Yarra Ranges (S) - Seville 16,287 0.4% 2<br />
1,116,985 25.5%<br />
103<br />
2 South 4 West<br />
Bayside (C) - Brighton 39,306 0.9% 4 Bellarine - Inner 25,551 0.6% 2<br />
Bayside (C) - South 57,977 1.3% 5 Brimbank (C) - Sunshine 96,412 2.2% 9<br />
Cardinia (S) - North 25,890 0.6% 2 Corio - Inner 60,234 1.4% 6<br />
Cardinia (S) - Pakenham 41,288 0.9% 4 Geelong 12,190 0.3% 1<br />
Cardinia (S) - South 6,140 0.1% 1 Geelong West 14,857 0.3% 1<br />
Casey (C) - Berwick 100,025 2.3% 9 Greater Geelong (C) - Pt B 38,215 0.9% 4<br />
Casey (C) - Cranbourne 84,059 1.9% 8 Greater Geelong (C) - Pt C 3,203 0.1% 0<br />
Casey (C) - Hallam 54,000 1.2% 5 Hobsons Bay (C) - Altona 55,470 1.3% 5<br />
Casey (C) - South 17,575 0.4% 2 Hobsons Bay (C) - Williamstown 32,583 0.7% 3<br />
Frankston (C) - East 50,795 1.2% 5 Maribyrnong (C) 72,896 1.7% 7<br />
Frankston (C) - West 79,667 1.8% 7 Melbourne (C) - Inner 15,427 0.4% 1<br />
Glen Eira (C) - Caulfield 84,453 1.9% 8 Melbourne (C) - Remainder 57,288 1.3% 5<br />
Glen Eira (C) - South 53,259 1.2% 5 Melbourne (C) - Southbank-Docklands 18,621 0.4% 2<br />
Gr. Dandenong (C) - Dandenong 60,453 1.4% 6 Melton (S) - East 57,670 1.3% 5<br />
Gr. Dandenong (C) Bal 78,105 1.8% 7 Melton (S) Bal 49,480 1.1% 5<br />
Kingston (C) - North 98,419 2.2% 9 Moorabool (S) - Bacchus Marsh 18,222 0.4% 2<br />
Kingston (C) - South 50,411 1.2% 5 Newtown 10,699 0.2% 1<br />
Monash (C) - South-West 48,333 1.1% 4 Queenscliffe (B) 3,314 0.1% 0<br />
Mornington Peninsula (S) - East 40,493 0.9% 4 South Barwon - Inner (part) 52,337 1.2% 5<br />
Mornington Peninsula (S) - South 50,738 1.2% 5 Surf Coast (S) - East (part) 6,286 0.1% 1<br />
Mornington Peninsula (S) - West 59,007 1.3% 5 Wyndham (C) - North 98,224 2.2% 9<br />
Port Phillip (C) - St Kilda 56,046 1.3% 5 Wyndham (C) - South 29,259 0.7% 3<br />
Port Phillip (C) - West 41,383 0.9% 4 Wyndham (C) - West 29,090 0.7% 3<br />
1,277,822 29.2% 119 857,528<br />
19.6%<br />
80<br />
TOTAL<br />
4,379,521 100% 405<br />
* 2010 Estimated Resident Population