In hierdie les hersien ons slegs die graad 11 variansie en ... - AdMaths
In hierdie les hersien ons slegs die graad 11 variansie en ... - AdMaths
In hierdie les hersien ons slegs die graad 11 variansie en ... - AdMaths

You also want an ePaper? Increase the reach of your titles
YUMPU automatically turns print PDFs into web optimized ePapers that Google loves.
GR. 12 THIRD PAPER<br />
DATA HANDLING (STATISTICS)<br />
VARIANCE AND STANDARD DEVIATION I<br />
LESSON 3<br />
Page 2 of <strong>11</strong><br />
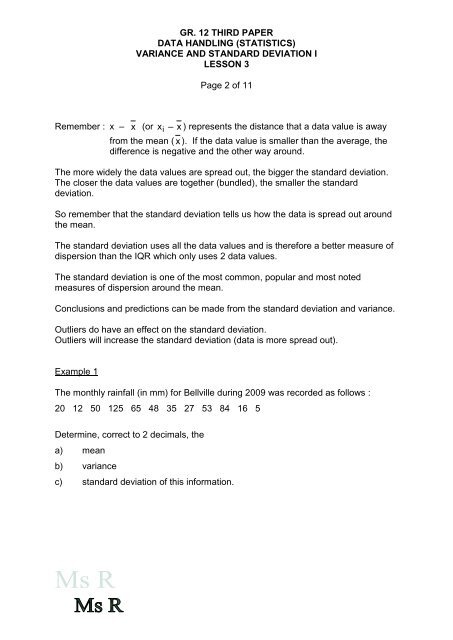
Remember : x – x (or xi – x ) repres<strong>en</strong>ts the distance that a data value is away<br />
from the mean ( x ). If the data value is smaller than the average, the<br />
differ<strong>en</strong>ce is negative and the other way around.<br />
The more widely the data values are spread out, the bigger the standard deviation.<br />
The closer the data values are together (bundled), the smaller the standard<br />
deviation.<br />
So remember that the standard deviation tells us how the data is spread out around<br />
the mean.<br />
The standard deviation uses all the data values and is therefore a better measure of<br />
dispersion than the IQR which only uses 2 data values.<br />
The standard deviation is one of the most common, popular and most noted<br />
measures of dispersion around the mean.<br />
Conclusi<strong>ons</strong> and predicti<strong>ons</strong> can be made from the standard deviation and variance.<br />
Outliers do have an effect on the standard deviation.<br />
Outliers will increase the standard deviation (data is more spread out).<br />
Example 1<br />
The monthly rainfall (in mm) for Bellville during 2009 was recorded as follows :<br />
20 12 50 125 65 48 35 27 53 84 16 5<br />
Determine, correct to 2 decimals, the<br />
a) mean<br />
b) variance<br />
c) standard deviation of this information.