In hierdie les hersien ons slegs die graad 11 variansie en ... - AdMaths
In hierdie les hersien ons slegs die graad 11 variansie en ... - AdMaths
In hierdie les hersien ons slegs die graad 11 variansie en ... - AdMaths

Create successful ePaper yourself
Turn your PDF publications into a flip-book with our unique Google optimized e-Paper software.
GR. 12 THIRD PAPER<br />
DATA HANDLING (STATISTICS)<br />
VARIANCE AND STANDARD DEVIATION I<br />
LESSON 3<br />
Page 1 of <strong>11</strong><br />
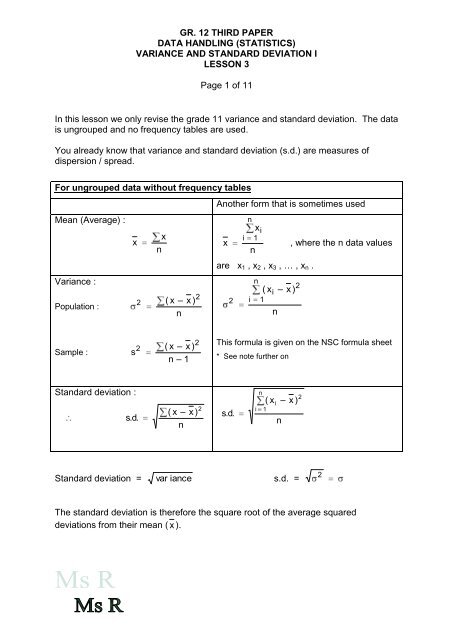
<strong>In</strong> this <strong>les</strong>son we only revise the grade <strong>11</strong> variance and standard deviation. The data<br />
is ungrouped and no frequ<strong>en</strong>cy tab<strong>les</strong> are used.<br />
You already know that variance and standard deviation (s.d.) are measures of<br />
dispersion / spread.<br />
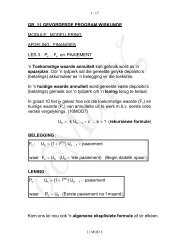
For ungrouped data without frequ<strong>en</strong>cy tab<strong>les</strong><br />
Mean (Average) :<br />
Variance :<br />
Population :<br />
Sample :<br />
x<br />
2<br />
2<br />
s<br />
Standard deviation :<br />
s.<br />
d.<br />
x<br />
n<br />
2<br />
( x – x )<br />
n<br />
2<br />
( x – x )<br />
n – 1<br />
( x – x )<br />
n<br />
2<br />
Another form that is sometimes used<br />
x<br />
n<br />
xi<br />
i 1<br />
n<br />
are x1 , x2 , x3 , … , xn .<br />
2<br />
i<br />
n<br />
( x<br />
1<br />
i<br />
n<br />
– x )<br />
, where the n data values<br />
2<br />
This formula is giv<strong>en</strong> on the NSC formula sheet<br />
* See note further on<br />
s.<br />
d.<br />
( x<br />
– x )<br />
Standard deviation = var iance<br />
s.d. =<br />
The standard deviation is therefore the square root of the average squared<br />
deviati<strong>ons</strong> from their mean ( x ).<br />
i<br />
n<br />
1<br />
i<br />
n<br />
2<br />
2
GR. 12 THIRD PAPER<br />
DATA HANDLING (STATISTICS)<br />
VARIANCE AND STANDARD DEVIATION I<br />
LESSON 3<br />
Page 2 of <strong>11</strong><br />
Remember : x – x (or xi – x ) repres<strong>en</strong>ts the distance that a data value is away<br />
from the mean ( x ). If the data value is smaller than the average, the<br />
differ<strong>en</strong>ce is negative and the other way around.<br />
The more widely the data values are spread out, the bigger the standard deviation.<br />
The closer the data values are together (bundled), the smaller the standard<br />
deviation.<br />
So remember that the standard deviation tells us how the data is spread out around<br />
the mean.<br />
The standard deviation uses all the data values and is therefore a better measure of<br />
dispersion than the IQR which only uses 2 data values.<br />
The standard deviation is one of the most common, popular and most noted<br />
measures of dispersion around the mean.<br />
Conclusi<strong>ons</strong> and predicti<strong>ons</strong> can be made from the standard deviation and variance.<br />
Outliers do have an effect on the standard deviation.<br />
Outliers will increase the standard deviation (data is more spread out).<br />
Example 1<br />
The monthly rainfall (in mm) for Bellville during 2009 was recorded as follows :<br />
20 12 50 125 65 48 35 27 53 84 16 5<br />
Determine, correct to 2 decimals, the<br />
a) mean<br />
b) variance<br />
c) standard deviation of this information.
Solution : ( using TABLES )<br />
x<br />
a) Mean ( x ) = ( OR<br />
n<br />
GR. 12 THIRD PAPER<br />
DATA HANDLING (STATISTICS)<br />
VARIANCE AND STANDARD DEVIATION I<br />
LESSON 3<br />
=<br />
20<br />
540<br />
=<br />
12<br />
Page 3 of <strong>11</strong><br />
12<br />
= 45 mm<br />
x<br />
50<br />
n<br />
xi<br />
i 1<br />
125<br />
n<br />
65<br />
)<br />
48 35<br />
12<br />
b) Variance : Remember that x = 45 mm from (a)<br />
Rainfall (x) in mm x – x ( x – x ) 2<br />
20 -25 625<br />
12 -33 1089<br />
50 5 25<br />
125 80 6400<br />
65 20 400<br />
48 3 9<br />
35 -10 100<br />
27 -18 324<br />
53 8 64<br />
84 39 1521<br />
16 -29 841<br />
5 -40 1600<br />
Som 12998<br />
Variance ( 2 ) =<br />
2<br />
( x – x )<br />
n<br />
12998<br />
=<br />
12<br />
27<br />
53<br />
84<br />
= 1083,17 mm 2<br />
16<br />
5
GR. 12 THIRD PAPER<br />
DATA HANDLING (STATISTICS)<br />
VARIANCE AND STANDARD DEVIATION I<br />
LESSON 3<br />
Page 4 of <strong>11</strong><br />
You could also have called the data values x1, x2, x3, …, xi and th<strong>en</strong> have<br />
used<br />
n<br />
2<br />
( xi<br />
– x )<br />
2 i 1<br />
.<br />
n<br />
c) Standard deviation (s.d.) =<br />
=<br />
=<br />
2<br />
2<br />
( x – x )<br />
n<br />
= 1083 , 17<br />
= 32,91 mm<br />
OR<br />
n<br />
2<br />
( xi<br />
– x )<br />
i 1<br />
n<br />
The square root has to be tak<strong>en</strong>, because the unit for variance is mm 2 and not mm.<br />
[ Also notice that you have used ( x – x ) 2 in the table and formula and th<strong>en</strong><br />
tak<strong>en</strong> the square root afterwards.<br />
Why is this necessary? Why did you not just use x – x ?<br />
That would have giv<strong>en</strong> you the correct unit namely mm immediately …<br />
Reason : Add column 2’s values …<br />
I.o.w. ( x – x )<br />
= -25 – 33 + 5 + 80 + 20 + 3 – 10 – 18 + 8 + 39 – 29 – 40<br />
= 0 !!!<br />
And such an answer for spread is meaning<strong>les</strong>s! ]
Solution : ( using CALCULATOR )<br />
GR. 12 THIRD PAPER<br />
DATA HANDLING (STATISTICS)<br />
VARIANCE AND STANDARD DEVIATION I<br />
LESSON 3<br />
Page 5 of <strong>11</strong><br />
Mean and standard deviation can be determined much quicker by using statistical<br />
functi<strong>ons</strong> on a calculator.<br />
Follow the instructi<strong>ons</strong> below for your specific calculator and test your answer.<br />
x = 45 mm and s.<br />
d.<br />
32,<br />
91 mm<br />
Raw data (Ungrouped)<br />
<strong>In</strong> stat mode<br />
Enter data values<br />
Mean<br />
Standard deviation<br />
(population)<br />
Standard deviation<br />
(sample)<br />
Clear memory<br />
Out of stat mode<br />
x<br />
SHARP EL – 531 WH CASIO FX – 82ES<br />
mode<br />
0<br />
Enter all data values (x1 etc.)<br />
followed by each time.<br />
M+<br />
RCL<br />
Use standard deviation (population)!<br />
1 0<br />
X<br />
RCL X<br />
RCL<br />
SX<br />
0<br />
2nd F CA AC<br />
mode 2 1<br />
Enter all data values followed by<br />
AC<br />
mode 0 mode 1<br />
and wh<strong>en</strong> finished.<br />
SHIFT STAT 5 2 =<br />
SHIFT STAT 5 3 =<br />
=
NOTE : WATCH OUT!<br />
GR. 12 THIRD PAPER<br />
DATA HANDLING (STATISTICS)<br />
VARIANCE AND STANDARD DEVIATION I<br />
LESSON 3<br />
Page 6 of <strong>11</strong><br />
On the formula sheet of the National S<strong>en</strong>ior Certificate (NSC)<br />
they give the<br />
s.<br />
d.<br />
n<br />
2<br />
( xi<br />
– x )<br />
i 1<br />
n<br />
Here xi does NOT repres<strong>en</strong>t the midpoint value as usual, but xi repres<strong>en</strong>ts<br />
the raw ungrouped data from x1 to xn!!<br />
Therefore it is the same formula used for raw ungrouped data without<br />
using a frequ<strong>en</strong>cy table!<br />
Example 2 ( Here we compare the standard deviation of 2 groups of data. )<br />
Take the reaction time in a test of 2 groups of learners from 2 differ<strong>en</strong>t classes.<br />
Gr. 12A<br />
Time (sec)<br />
Gr. 12B<br />
Time (sec)<br />
Determine the<br />
a) mean<br />
b) variance<br />
70 21 60 84 63 55<br />
58 59 45 56 69 66<br />
c) standard deviation of the reaction time of 2 classes.
Solution : ( using TABLES )<br />
a) Gr. 12A<br />
x<br />
70<br />
Gr. 12B<br />
x<br />
21<br />
353<br />
6<br />
58,<br />
8 sec<br />
58<br />
59<br />
353<br />
6<br />
58,<br />
8 sec<br />
GR. 12 THIRD PAPER<br />
DATA HANDLING (STATISTICS)<br />
VARIANCE AND STANDARD DEVIATION I<br />
LESSON 3<br />
60 84<br />
6<br />
45 56<br />
6<br />
63<br />
69<br />
Page 7 of <strong>11</strong><br />
55<br />
66<br />
Coincid<strong>en</strong>tly the same mean implies that we can compare them easier.<br />
b) Gr. 12A<br />
Data (x) x – x (x – x ) 2<br />
70 <strong>11</strong>,2 125,44<br />
21 -37,8 1 428,84<br />
60 1,2 1,44<br />
84 25,2 635,04<br />
63 4,2 17,64<br />
55 -3,8 14,44<br />
Sum 2 222,84
Variance ( 2 ) =<br />
GR. 12 THIRD PAPER<br />
DATA HANDLING (STATISTICS)<br />
VARIANCE AND STANDARD DEVIATION I<br />
LESSON 3<br />
=<br />
Page 8 of <strong>11</strong><br />
2<br />
( x – x )<br />
n<br />
2222,<br />
84<br />
6<br />
= 370,47 sec 2<br />
This causes a problem, because the unit for reaction time is now sec 2 !<br />
Gr. 12B<br />
Data (x) x – x (x – x ) 2<br />
58 -0,8 0,64<br />
59 0,2 0,04<br />
45 -13,8 190,44<br />
56 -2,8 7,84<br />
69 10,2 104,04<br />
66 7,2 51,84<br />
Sum 354,84<br />
Variance ( 2 ) =<br />
=<br />
2<br />
( x – x )<br />
n<br />
354,<br />
84<br />
6<br />
= 59,14 sec 2
c) Gr. 12A<br />
GR. 12 THIRD PAPER<br />
DATA HANDLING (STATISTICS)<br />
VARIANCE AND STANDARD DEVIATION I<br />
LESSON 3<br />
Standard deviation = var iance<br />
Gr12B<br />
Page 9 of <strong>11</strong><br />
2<br />
( x x)<br />
n<br />
= 370 , 47<br />
= 19,25<br />
Standard deviation = var iance<br />
2<br />
( x x)<br />
n<br />
= 59 , 14<br />
= 7,69<br />
Solution : ( using CALCULATOR )<br />
Redo the problem and use your calculator this time. Follow the steps on the<br />
diagram. Check your answers.<br />
Gr. 12A Gr. 12B<br />
Mean 58,8 sec 58,8 sec<br />
Standard deviation 19,25 sec 7,69 sec
EXERCISE 3<br />
GR. 12 THIRD PAPER<br />
DATA HANDLING (STATISTICS)<br />
VARIANCE AND STANDARD DEVIATION I<br />
LESSON 3<br />
Page 10 of <strong>11</strong><br />
1. The total daily muffin sa<strong>les</strong> at the school’s tuck shop for the past 3 weeks<br />
was as follows :<br />
15 27 25 45 73 18 17 34 57 61 21 19 43 56 89<br />
1.1 Show all calculati<strong>ons</strong> and determine the following correct to 2 decimals :<br />
( Note : No statistical functi<strong>ons</strong> on your calculator may be used.)<br />
1.1.1 mean<br />
1.1.2 standard deviation<br />
1.2 Now test your answers by using the statistical functi<strong>ons</strong> on your calculator.<br />
2. The number of oranges in 2 kg bags was<br />
15 ; 10 ; 12 ; 17 ; 9 ; 13 ; 14 ; <strong>11</strong> ; 15 ; 16 ; 17 ; 14<br />
Determine :<br />
2.1 the mean number of oranges in the bags<br />
2.2 the standard deviation of the number of oranges in the bags.<br />
3. The netball coach must decide which of her goal shooters must play the goal<br />
shooter at the next match. Here follow the mean number of goals per match<br />
for three goal shooters.<br />
Lizelle : 5 8 10 3 7<br />
Suzi : 9 7 4 3 2 1 <strong>11</strong><br />
Marthie : 13 4 8 <strong>11</strong><br />
3.1 Determine the mean for all three goal shooters.<br />
3.2 Determine the standard deviation for all three goal shooters.<br />
3.3 Who must she choose?
GR. 12 THIRD PAPER<br />
DATA HANDLING (STATISTICS)<br />
VARIANCE AND STANDARD DEVIATION I<br />
LESSON 3<br />
Page <strong>11</strong> of <strong>11</strong><br />
4. Five numbers 12 ; 15 ; 7 ; x and y has a mean of 13 and a standard<br />
deviation of 13. Determine the values of x and y correct to 2 decimals if x<br />
is positive.<br />
5. Gr 12! Advanced! Try this sum with grouped data and frequ<strong>en</strong>cy tab<strong>les</strong>.<br />
(Lesson 5)<br />
Marilu is a human resource manager. She made a summary of the daily<br />
wages of the workers in a company.<br />
The results were as follows:<br />
Daily wages<br />
(in Rands)<br />
Number of wom<strong>en</strong> Number of m<strong>en</strong><br />
70 x < 75 5 3<br />
75 x < 80 15 5<br />
80 x < 85 25 10<br />
85 x < 90 30 15<br />
90 x < 95 16 20<br />
95 x < 100 14 18<br />
100 x < 105 10 16<br />
105 x < <strong>11</strong>0 8 20<br />
5.1 Determine the mean daily wages of both groups.<br />
5.2 Determine the standard deviation in daily wages for both groups.<br />
5.3 Is there a big differ<strong>en</strong>ce in their wages? Discuss.