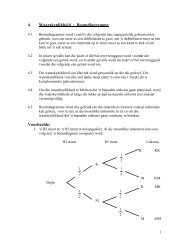
In hierdie les hersien ons slegs die graad 11 variansie en ... - AdMaths
In hierdie les hersien ons slegs die graad 11 variansie en ... - AdMaths
In hierdie les hersien ons slegs die graad 11 variansie en ... - AdMaths

You also want an ePaper? Increase the reach of your titles
YUMPU automatically turns print PDFs into web optimized ePapers that Google loves.
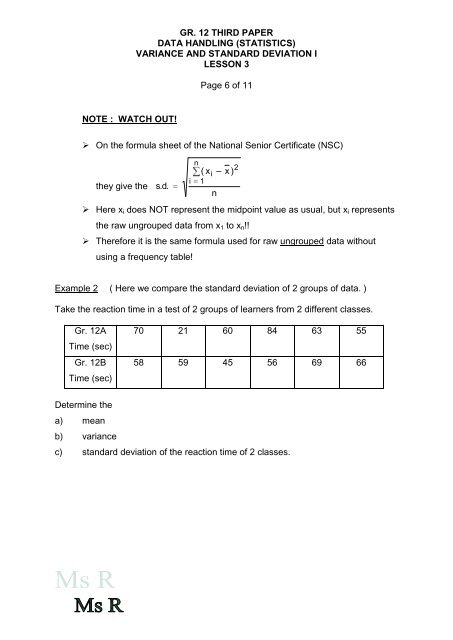
NOTE : WATCH OUT!<br />
GR. 12 THIRD PAPER<br />
DATA HANDLING (STATISTICS)<br />
VARIANCE AND STANDARD DEVIATION I<br />
LESSON 3<br />
Page 6 of <strong>11</strong><br />
On the formula sheet of the National S<strong>en</strong>ior Certificate (NSC)<br />
they give the<br />
s.<br />
d.<br />
n<br />
2<br />
( xi<br />
– x )<br />
i 1<br />
n<br />
Here xi does NOT repres<strong>en</strong>t the midpoint value as usual, but xi repres<strong>en</strong>ts<br />
the raw ungrouped data from x1 to xn!!<br />
Therefore it is the same formula used for raw ungrouped data without<br />
using a frequ<strong>en</strong>cy table!<br />
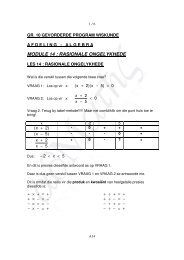
Example 2 ( Here we compare the standard deviation of 2 groups of data. )<br />
Take the reaction time in a test of 2 groups of learners from 2 differ<strong>en</strong>t classes.<br />
Gr. 12A<br />
Time (sec)<br />
Gr. 12B<br />
Time (sec)<br />
Determine the<br />
a) mean<br />
b) variance<br />
70 21 60 84 63 55<br />
58 59 45 56 69 66<br />
c) standard deviation of the reaction time of 2 classes.