Consolidated Annual Report 2012 and Single-Entity ... - PVA TePla AG
Consolidated Annual Report 2012 and Single-Entity ... - PVA TePla AG
Consolidated Annual Report 2012 and Single-Entity ... - PVA TePla AG

You also want an ePaper? Increase the reach of your titles
YUMPU automatically turns print PDFs into web optimized ePapers that Google loves.
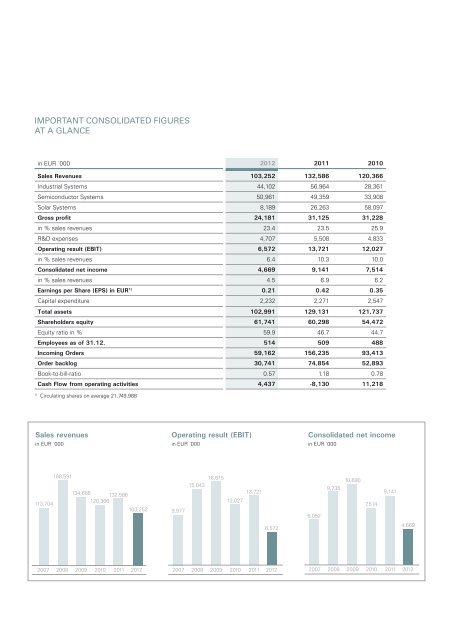
IMPORTANT CONSOLIDATED FIGURES<br />
AT A GLANCE<br />
in EUR ´000 <strong>2012</strong> 2011 2010<br />
Sales Revenues 103,252 132,586 120,366<br />
Industrial Systems 44,102 56,964 28,361<br />
Semiconductor Systems 50,961 49,359 33,908<br />
Solar Systems 8,189 26,263 58,097<br />
Gross profit 24,181 31,125 31,228<br />
in % sales revenues 23.4 23.5 25.9<br />
R&D expenses 4,707 5,508 4,833<br />
Operating result (EBIT) 6,572 13,721 12,027<br />
in % sales revenues 6.4 10.3 10.0<br />
<strong>Consolidated</strong> net income 4,669 9,141 7,514<br />
in % sales revenues 4.5 6.9 6.2<br />
Earnings per Share (EPS) in EUR1) 0.21 0.42 0.35<br />
Capital expenditure 2,232 2,271 2,547<br />
Total assets 102,991 129,131 121,737<br />
Shareholders equity 61,741 60,298 54,472<br />
Equity ratio in % 59.9 46.7 44.7<br />
Employees as of 31.12. 514 509 488<br />
Incoming Orders 59,162 156,235 93,413<br />
Order backlog 30,741 74,854 52,893<br />
Book-to-bill-ratio 0.57 1.18 0.78<br />
Cash Flow from operating activities 4,437 -8,130 11,218<br />
1) Circulating shares on average 21,749,988<br />
Sales revenues<br />
in EUR ´000<br />
113,704<br />
168,591<br />
134,688 132,586<br />
120,366<br />
103,252<br />
Operating result (EBIT)<br />
in EUR ´000<br />
9,977<br />
16,615<br />
15,043<br />
13,721<br />
12,027<br />
<strong>Consolidated</strong> net income<br />
in EUR ´000<br />
2007 2008 2009 2010 2011 <strong>2012</strong> 2007 2008 2009 2010 2011 <strong>2012</strong> 2007 2008 2009 2010 2011 <strong>2012</strong><br />
6,572<br />
6,052<br />
9,735<br />
10,690<br />
7,514<br />
9,141<br />
4,669