Consolidated Annual Report 2012 and Single-Entity ... - PVA TePla AG
Consolidated Annual Report 2012 and Single-Entity ... - PVA TePla AG
Consolidated Annual Report 2012 and Single-Entity ... - PVA TePla AG

You also want an ePaper? Increase the reach of your titles
YUMPU automatically turns print PDFs into web optimized ePapers that Google loves.
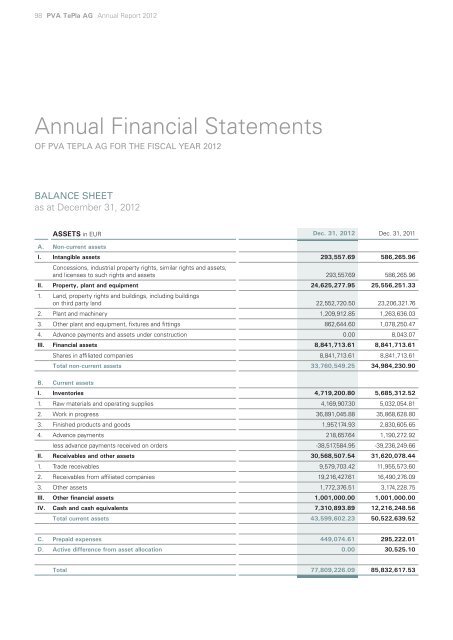
98 <strong>PVA</strong> <strong>TePla</strong> <strong>AG</strong> <strong>Annual</strong> <strong>Report</strong> <strong>2012</strong><br />
<strong>Annual</strong> Financial Statements<br />
OF <strong>PVA</strong> TEPLA <strong>AG</strong> FOR THE FISCAL YEAR <strong>2012</strong><br />
bALANCE SHEET<br />
as at December 31, <strong>2012</strong><br />
ASSETS in EUR Dec. 31, <strong>2012</strong> Dec. 31, 2011<br />
A. Non-current assets<br />
I. Intangible assets<br />
Concessions, industrial property rights, similar rights <strong>and</strong> assets,<br />
293,557.69 586,265.96<br />
<strong>and</strong> licenses to such rights <strong>and</strong> assets 293,557.69 586,265.96<br />
II. Property, plant <strong>and</strong> equipment 24,625,277.95 25,556,251.33<br />
1. L<strong>and</strong>, property rights <strong>and</strong> buildings, including buildings<br />
on third party l<strong>and</strong> 22,552,720.50 23,206,321.76<br />
2. Plant <strong>and</strong> machinery 1,209,912.85 1,263,636.03<br />
3. Other plant <strong>and</strong> equipment, fixtures <strong>and</strong> fittings 862,644.60 1,078,250.47<br />
4. Advance payments <strong>and</strong> assets under construction 0.00 8,043.07<br />
III. Financial assets 8,841,713.61 8,841,713.61<br />
Shares in affiliated companies 8,841,713.61 8,841,713.61<br />
Total non-current assets 33,760,549.25 34,984,230.90<br />
B. Current assets<br />
I. Inventories 4,719,200.80 5,685,312.52<br />
1. Raw materials <strong>and</strong> operating supplies 4,169,907.30 5,032,054.81<br />
2. Work in progress 36,891,045.88 35,868,628.80<br />
3. Finished products <strong>and</strong> goods 1,957,174.93 2,830,605.65<br />
4. Advance payments 218,657.64 1,190,272.92<br />
less advance payments received on orders -38,517,584.95 -39,236,249.66<br />
II. Receivables <strong>and</strong> other assets 30,568,507.54 31,620,078.44<br />
1. Trade receivables 9,579,703.42 11,955,573.60<br />
2. Receivables from affiliated companies 19,216,427.61 16,490,276.09<br />
3. Other assets 1,772,376.51 3,174,228.75<br />
III. Other financial assets 1,001,000.00 1,001,000.00<br />
IV. Cash <strong>and</strong> cash equivalents 7,310,893.89 12,216,248.56<br />
Total current assets 43,599,602.23 50,522,639.52<br />
C. Prepaid expenses 449,074.61 295,222.01<br />
D. Active difference from asset allocation 0.00 30,525.10<br />
Total 77,809,226.09 85,832,617.53