

2005 Annual Report - SBM Offshore
2005 Annual Report - SBM Offshore
2005 Annual Report - SBM Offshore

You also want an ePaper? Increase the reach of your titles
YUMPU automatically turns print PDFs into web optimized ePapers that Google loves.
Shareholder information<br />
Share listing<br />
The shares of <strong>SBM</strong> <strong>Offshore</strong> N.V. (par value € 1.00) are listed<br />
on the stock exchange of Amsterdam since 11 October 1965,<br />
originally under the name IHC Holland and later as IHC<br />
Caland. The shares are included in the AEX Index of Euronext<br />
Amsterdam since 4 March 2003. On 2 May <strong>2005</strong> the shares<br />
were for the first time listed under the current name <strong>SBM</strong><br />
<strong>Offshore</strong>. Out of the 23 participants in the index at year-end<br />
<strong>2005</strong>, the Company ranked 19th on the basis of market<br />
capitalisation, with a weighting of 0.59%, and 22nd on the<br />
basis of turnover. Options on Company shares have been<br />
traded since 7 July 1993 on the Euronext Amsterdam<br />
Derivative Markets. The revised Articles of Association<br />
adopted by the Extraordinary General Meeting of<br />
Shareholders of 11 February <strong>2005</strong> provided the Company with<br />
the option to dematerialise its shares. This change was<br />
effected on 31 October <strong>2005</strong>, replacing the bearer shares by<br />
a share register.<br />
Share price development<br />
The share price went up during the year <strong>2005</strong> by 46% from<br />
€ 46.74 to € 68.25, thereby outperforming the AEX by<br />
20.5%, compared with an outperformance by 5% in 2004.<br />
In US Dollar terms the increase of the share price in <strong>2005</strong> was<br />
26.7%, from US$ 63.47 to US$ 80.41.<br />
Dividend<br />
As in previous years, the annual dividend will be calculated in<br />
US Dollars, but will be payable in Euros. The conversion into<br />
Euros will be effected on the basis of the exchange rate on 19<br />
May 2006. The same exchange rate will apply in the event a<br />
shareholder elects for a dividend payment in shares of <strong>SBM</strong><br />
<strong>Offshore</strong>. Based on the year-end closing price, the proposed<br />
dividend of US$ 3.30 per share gives a yield of 4.0% per<br />
share (2004: 2.7%). The proposed dividend is based upon the<br />
Company’s usual 50% pay-out ratio, and taking into account<br />
the exceptional net income from the FPSO Serpentina<br />
transaction.<br />
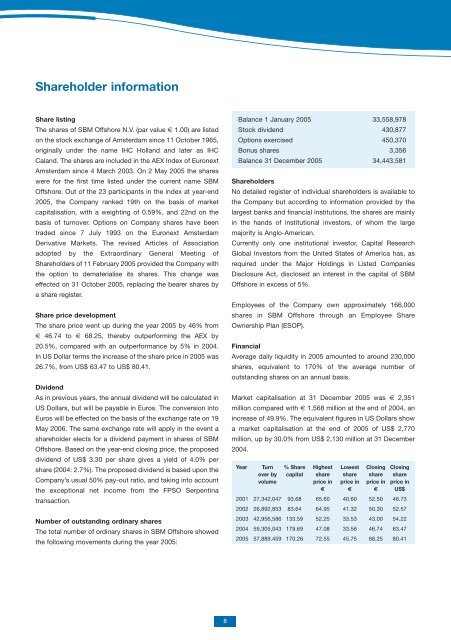
Number of outstanding ordinary shares<br />
The total number of ordinary shares in <strong>SBM</strong> <strong>Offshore</strong> showed<br />
the following movements during the year <strong>2005</strong>:<br />
8<br />
Balance 1 January <strong>2005</strong> 33,558,978<br />
Stock dividend 430,877<br />
Options exercised 450,370<br />
Bonus shares 3,356<br />
Balance 31 December <strong>2005</strong> 34,443,581<br />
Shareholders<br />
No detailed register of individual shareholders is available to<br />
the Company but according to information provided by the<br />
largest banks and financial institutions, the shares are mainly<br />
in the hands of institutional investors, of whom the large<br />
majority is Anglo-American.<br />
Currently only one institutional investor, Capital Research<br />
Global Investors from the United States of America has, as<br />
required under the Major Holdings in Listed Companies<br />
Disclosure Act, disclosed an interest in the capital of <strong>SBM</strong><br />
<strong>Offshore</strong> in excess of 5%.<br />
Employees of the Company own approximately 166,000<br />
shares in <strong>SBM</strong> <strong>Offshore</strong> through an Employee Share<br />
Ownership Plan (ESOP).<br />
Financial<br />
Average daily liquidity in <strong>2005</strong> amounted to around 230,000<br />
shares, equivalent to 170% of the average number of<br />
outstanding shares on an annual basis.<br />
Market capitalisation at 31 December <strong>2005</strong> was € 2,351<br />
million compared with € 1,568 million at the end of 2004, an<br />
increase of 49.9%. The equivalent figures in US Dollars show<br />
a market capitalisation at the end of <strong>2005</strong> of US$ 2,770<br />
million, up by 30.0% from US$ 2,130 million at 31 December<br />
2004.<br />
Year Turn % Share Highest Lowest Closing Closing<br />
over by capital share share share share<br />
volume price in price in price in price in<br />
€ € € US$<br />
2001 27,342,047 93.68 65.60 40.60 52.50 46.73<br />
2002 26,892,853 83.64 64.95 41.32 50.30 52.57<br />
2003 42,956,586 133.59 52.25 33.53 43.00 54.22<br />
2004 59,305,043 179.69 47.08 33.56 46.74 63.47<br />
<strong>2005</strong> 57,889.459 170.26 72.55 45.75 68.25 80.41


