Getting Started with Your 2700 Series Instrument
Getting Started with Your 2700 Series Instrument
Getting Started with Your 2700 Series Instrument

You also want an ePaper? Increase the reach of your titles
YUMPU automatically turns print PDFs into web optimized ePapers that Google loves.
Sweeps Chapter 5: Quick Guides<br />
field change also.) In the Top field, type 0.1. In the Bottom field,<br />
type –0.1.<br />
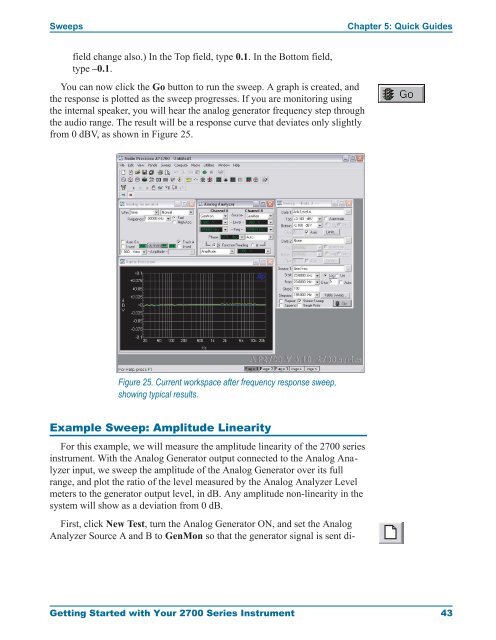
You can now click the Go button to run the sweep. A graph is created, and<br />
the response is plotted as the sweep progresses. If you are monitoring using<br />
the internal speaker, you will hear the analog generator frequency step through<br />
the audio range. The result will be a response curve that deviates only slightly<br />
from 0 dBV, as shown in Figure 25.<br />
Figure 25. Current workspace after frequency response sweep,<br />
showing typical results.<br />
Example Sweep: Amplitude Linearity<br />
For this example, we will measure the amplitude linearity of the <strong>2700</strong> series<br />
instrument. With the Analog Generator output connected to the Analog Analyzer<br />
input, we sweep the amplitude of the Analog Generator over its full<br />
range, and plot the ratio of the level measured by the Analog Analyzer Level<br />
meters to the generator output level, in dB. Any amplitude non-linearity in the<br />
system will show as a deviation from 0 dB.<br />
First, click New Test, turn the Analog Generator ON, and set the Analog<br />
Analyzer Source A and B to GenMon so that the generator signal is sent di-<br />
<strong>Getting</strong> <strong>Started</strong> <strong>with</strong> <strong>Your</strong> <strong>2700</strong> <strong>Series</strong> <strong>Instrument</strong> 43