evox 5.0 users manual - Zyto
evox 5.0 users manual - Zyto
evox 5.0 users manual - Zyto

Create successful ePaper yourself
Turn your PDF publications into a flip-book with our unique Google optimized e-Paper software.
Chapter 7<br />
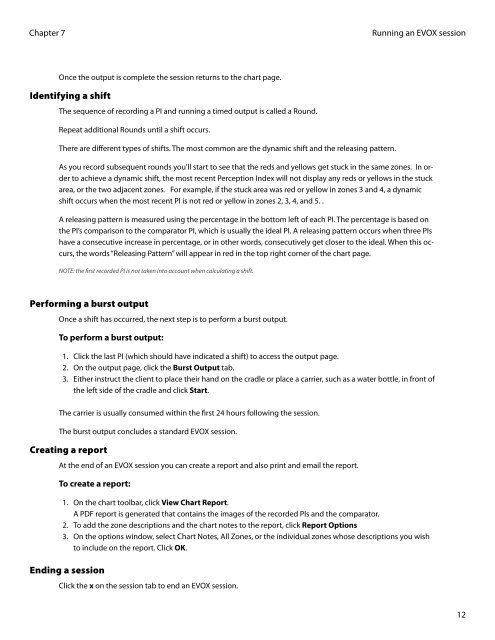
Once the output is complete the session returns to the chart page.<br />
Identifying a shift<br />
The sequence of recording a PI and running a timed output is called a Round.<br />
Repeat additional Rounds until a shift occurs.<br />
There are different types of shifts. The most common are the dynamic shift and the releasing pattern.<br />
Running an EVOX session<br />
As you record subsequent rounds you’ll start to see that the reds and yellows get stuck in the same zones. In order<br />
to achieve a dynamic shift, the most recent Perception Index will not display any reds or yellows in the stuck<br />
area, or the two adjacent zones. For example, if the stuck area was red or yellow in zones 3 and 4, a dynamic<br />
shift occurs when the most recent PI is not red or yellow in zones 2, 3, 4, and 5. .<br />
A releasing pattern is measured using the percentage in the bottom left of each PI. The percentage is based on<br />
the PI’s comparison to the comparator PI, which is usually the ideal PI. A releasing pattern occurs when three PIs<br />
have a consecutive increase in percentage, or in other words, consecutively get closer to the ideal. When this occurs,<br />
the words “Releasing Pattern” will appear in red in the top right corner of the chart page.<br />
NOTE: the first recorded PI is not taken into account when calculating a shift.<br />
Performing a burst output<br />
Once a shift has occurred, the next step is to perform a burst output.<br />
To perform a burst output:<br />
1. Click the last PI (which should have indicated a shift) to access the output page.<br />
2. On the output page, click the Burst Output tab.<br />
3. Either instruct the client to place their hand on the cradle or place a carrier, such as a water bottle, in front of<br />
the left side of the cradle and click Start.<br />
The carrier is usually consumed within the first 24 hours following the session.<br />
The burst output concludes a standard EVOX session.<br />
Creating a report<br />
At the end of an EVOX session you can create a report and also print and email the report.<br />
To create a report:<br />
1. On the chart toolbar, click View Chart Report.<br />
A PDF report is generated that contains the images of the recorded PIs and the comparator.<br />
2. To add the zone descriptions and the chart notes to the report, click Report Options<br />
3. On the options window, select Chart Notes, All Zones, or the individual zones whose descriptions you wish<br />
to include on the report. Click OK.<br />
Ending a session<br />
Click the x on the session tab to end an EVOX session.<br />
12