Central Falls Transformation Report - Annenberg Institute for School ...
Central Falls Transformation Report - Annenberg Institute for School ...
Central Falls Transformation Report - Annenberg Institute for School ...

Create successful ePaper yourself
Turn your PDF publications into a flip-book with our unique Google optimized e-Paper software.
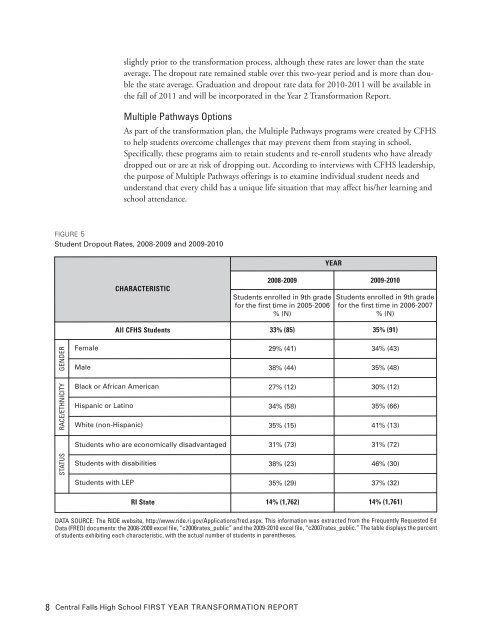
slightly prior to the trans<strong>for</strong>mation process, although these rates are lower than the state<br />
average. The dropout rate remained stable over this two-year period and is more than double<br />
the state average. Graduation and dropout rate data <strong>for</strong> 2010-2011 will be available in<br />
the fall of 2011 and will be incorporated in the Year 2 <strong>Trans<strong>for</strong>mation</strong> <strong>Report</strong>.<br />
Multiple Pathways Options<br />
As part of the trans<strong>for</strong>mation plan, the Multiple Pathways programs were created by CFHS<br />
to help students overcome challenges that may prevent them from staying in school.<br />
Specifically, these programs aim to retain students and re-enroll students who have already<br />
dropped out or are at risk of dropping out. According to interviews with CFHS leadership,<br />
the purpose of Multiple Pathways offerings is to examine individual student needs and<br />
understand that every child has a unique life situation that may affect his/her learning and<br />
school attendance.<br />
FIGURE 5<br />
Student Dropout Rates, 2008-2009 and 2009-2010<br />
GENDER<br />
RACE/ETHNICITY<br />
STATUS<br />
CHARACTERISTIC<br />
8 <strong>Central</strong> <strong>Falls</strong> High <strong>School</strong> FIRST YEAR TRANSFORMATION REPORT<br />
YEAR<br />
2008-2009 2009-2010<br />
Students enrolled in 9th grade<br />
<strong>for</strong> the first time in 2005-2006<br />
% (N)<br />
Students enrolled in 9th grade<br />
<strong>for</strong> the first time in 2006-2007<br />
% (N)<br />
All CFHS Students 33% (85) 35% (91)<br />
Female 29% (41) 34% (43)<br />
Male 38% (44) 35% (48)<br />
Black or African American 27% (12) 30% (12)<br />
Hispanic or Latino 34% (58) 35% (66)<br />
White (non-Hispanic) 35% (15) 41% (13)<br />
Students who are economically disadvantaged 31% (73) 31% (72)<br />
Students with disabilities 38% (23) 46% (30)<br />
Students with LEP 35% (29) 37% (32)<br />
RI State 14% (1,762) 14% (1,761)<br />
DATA SOURCE: The RIDE website, http://www.ride.ri.gov/Applications/fred.aspx. This in<strong>for</strong>mation was extracted from the Frequently Requested Ed<br />
Data (FRED) documents: the 2008-2009 excel file, “c2006rates_public” and the 2009-2010 excel file, “c2007rates_public.” The table displays the percent<br />
of students exhibiting each characteristic, with the actual number of students in parentheses.