Central Falls Transformation Report - Annenberg Institute for School ...
Central Falls Transformation Report - Annenberg Institute for School ...
Central Falls Transformation Report - Annenberg Institute for School ...

You also want an ePaper? Increase the reach of your titles
YUMPU automatically turns print PDFs into web optimized ePapers that Google loves.
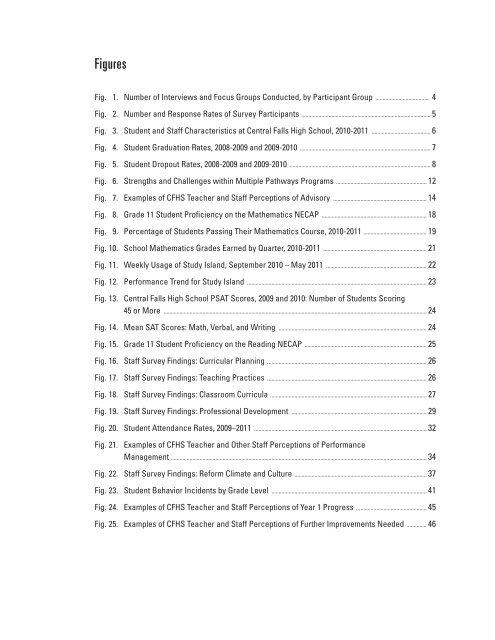
Figures<br />
Fig. 1. Number of Interviews and Focus Groups Conducted, by Participant Group ..................................... 4<br />
Fig. 2. Number and Response Rates of Survey Participants .......................................................................................... 5<br />
Fig. 3. Student and Staff Characteristics at <strong>Central</strong> <strong>Falls</strong> High <strong>School</strong>, 2010-2011 ......................................... 6<br />
Fig. 4. Student Graduation Rates, 2008-2009 and 2009-2010 ........................................................................................... 7<br />
Fig. 5. Student Dropout Rates, 2008-2009 and 2009-2010 .................................................................................................. 8<br />
Fig. 6. Strengths and Challenges within Multiple Pathways Programs ............................................................... 12<br />
Fig. 7. Examples of CFHS Teacher and Staff Perceptions of Advisory ................................................................. 14<br />
Fig. 8. Grade 11 Student Proficiency on the Mathematics NECAP ......................................................................... 18<br />
Fig. 9. Percentage of Students Passing Their Mathematics Course, 2010-2011 ............................................ 19<br />
Fig. 10. <strong>School</strong> Mathematics Grades Earned by Quarter, 2010-2011 ........................................................................ 21<br />
Fig. 11. Weekly Usage of Study Island, September 2010 – May 2011 ...................................................................... 22<br />
Fig. 12. Per<strong>for</strong>mance Trend <strong>for</strong> Study Island ............................................................................................................................. 23<br />
Fig. 13. <strong>Central</strong> <strong>Falls</strong> High <strong>School</strong> PSAT Scores, 2009 and 2010: Number of Students Scoring<br />
45 or More ....................................................................................................................................................................................... 24<br />
Fig. 14. Mean SAT Scores: Math, Verbal, and Writing ....................................................................................................... 24<br />
Fig. 15. Grade 11 Student Proficiency on the Reading NECAP ..................................................................................... 25<br />
Fig. 16. Staff Survey Findings: Curricular Planning ............................................................................................................... 26<br />
Fig. 17. Staff Survey Findings: Teaching Practices ............................................................................................................... 26<br />
Fig. 18. Staff Survey Findings: Classroom Curricula ............................................................................................................. 27<br />
Fig. 19. Staff Survey Findings: Professional Development .............................................................................................. 29<br />
Fig. 20. Student Attendance Rates, 2009–2011 ........................................................................................................................ 32<br />
Fig. 21. Examples of CFHS Teacher and Other Staff Perceptions of Per<strong>for</strong>mance<br />
Management .................................................................................................................................................................................. 34<br />
Fig. 22. Staff Survey Findings: Re<strong>for</strong>m Climate and Culture ............................................................................................ 37<br />
Fig. 23. Student Behavior Incidents by Grade Level ............................................................................................................ 41<br />
Fig. 24. Examples of CFHS Teacher and Staff Perceptions of Year 1 Progress ................................................. 45<br />
Fig. 25. Examples of CFHS Teacher and Staff Perceptions of Further Improvements Needed .............. 46