Quality-Based Design with Probabilistic Methods - ANSYS Users
Quality-Based Design with Probabilistic Methods - ANSYS Users
Quality-Based Design with Probabilistic Methods - ANSYS Users

You also want an ePaper? Increase the reach of your titles
YUMPU automatically turns print PDFs into web optimized ePapers that Google loves.
<strong>ANSYS</strong> Solutions<br />
<strong>Quality</strong>-<strong>Based</strong> <strong>Design</strong> <strong>with</strong><br />
<strong>Probabilistic</strong> <strong>Methods</strong><br />
Accounting for scatter of input parameters improves analysis<br />
results.<br />
By Dr. Stefan Reh<br />
Sr. Development Engineer, <strong>ANSYS</strong>, Inc.<br />
Dr. Paul Lethbridge<br />
<strong>ANSYS</strong> MEMS Initiative Manager, <strong>ANSYS</strong>, Inc.<br />
Dale Ostergaard<br />
Group Leader, Multiphysics Development,<br />
<strong>ANSYS</strong>, Inc.<br />
needs to be recognized that a single answer to<br />
a set of inputs is of limited value <strong>with</strong>out an “It<br />
understanding of the variation.” In the last issue<br />
of <strong>ANSYS</strong> Solutions magazine, G. Deleonardo, a Sr. Engineer<br />
at the Engineering Mechanics Laboratory of Gen-<br />
eral Electric, provided this provocative but correct<br />
statement. He stressed the significant difference between<br />
finite element (FE) models and reality: in real-life<br />
all input parameters are subjected to scatter. The geometry<br />
of components can only be manufactured <strong>with</strong>in<br />
certain tolerances. To strive for perfection is neither<br />
physically possible nor financially acceptable. Lab tests<br />
clearly reveal that material properties also are subjected<br />
to scatter. The same holds true for boundary con-<br />
ditions and loads. With the development of the <strong>ANSYS</strong><br />
<strong>Probabilistic</strong> <strong>Design</strong> System (PDS), <strong>ANSYS</strong>, Inc., has acknowledged<br />
how important the variations of input pa-<br />
rameters are. <strong>ANSYS</strong>/PDS will be implemented in <strong>ANSYS</strong><br />
5.7. In general, probabilistic methods can be used to<br />
answer the following questions:<br />
1. How large is the scatter of the parameters<br />
describing the behavior of the component?<br />
2. What is the probability that a performance<br />
criterion of the component is no longer met?<br />
3. What are the input parameters that need to<br />
be addressed in order to achieve a reliable<br />
design and improved quality?<br />
The answers automatically lead to measures that can<br />
be implemented as part of the quality control in the man-<br />
ufacturing process. The remainder of this article outlines<br />
a probabilistic analysis performed on a micro-electro-<br />
20 Volume 2, Number 2 <strong>ANSYS</strong> Solutions<br />
mechanical system (MEMS) that illustrates how AN-<br />
SYS/PDS can be used to understand variations and derive<br />
measures for quality improvement and cost reduction.<br />
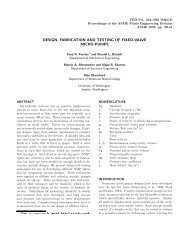
The Analysis Model<br />
Figure 1: Micro-electro-mechanical linear<br />
resonator<br />
The model is a micromachined lateral resonator<br />
consisting of two comb drives and a folded-spring mass<br />
assembly (Figure 1).<br />
Figure 2: Illustration of the tooth model<br />
The model used for the analysis considers one tooth<br />
of the moving comb and the two neighboring static<br />
comb teeth, plus the ground plane electrode (Figure<br />
2). For the probabilistic analysis, the effects of the<br />
manufacturing tolerances on the electrostatic force on<br />
the moving comb tooth are investigated. A full electrostatic<br />
finite element analysis (FEA) using <strong>ANSYS</strong> 5.6 is<br />
performed, and the electrostatic force is calculated.<br />
The FE model is constructed by extruding a large air<br />
volume around a tooth model and subtracting the tooth
model from the air volume <strong>with</strong> Boolean operations.<br />
The resulting electrostatic “domain” is meshed (Figure<br />
3). The electrostatic far-field behavior is modeled by<br />
“infinite” elements at the exterior of the “domain.”<br />
Figure 3: FE mesh – only electrostatic<br />
“domain” shown<br />
As illustrated in Figure 2, the potential difference of<br />
25V is applied across the ground plane and the static<br />
comb. Equipotential contours of the voltage are shown<br />
in Figure 4.<br />
The electrostatic force, K, is the derivative of the<br />
electrostatic energy, W, <strong>with</strong> respect to the stroke, S.<br />
Since the energy is a very smooth function of the stroke,<br />
a simple forward finite-differencing scheme given by<br />
Equation 1 has been applied:<br />
F = W(S+ΔS)−W(S)<br />
ΔS<br />
The electrostatic energy, W,can be extracted from<br />
the FE results.<br />
Figure 4: Equipotential contours of voltage<br />
The <strong>Probabilistic</strong> Model<br />
<strong>ANSYS</strong>/PDS allows for the definition of random variables<br />
(and random fields) based on various statistical<br />
distribution functions. Due to the lack of data, a normal<br />
distribution was assumed for all 14 input variables. All<br />
tolerances are defined as a deviation from the nominal<br />
geometry, i.e., <strong>with</strong> a mean value of 0.0. The 14 random<br />
input variables and their standard deviations (in µm)<br />
are listed in Table 1.<br />
Name Description St. Dev.<br />
MCTHDL Moving comb tooth delta length 0.125<br />
MCTHDW Moving comb tooth delta width 0.125<br />
MCSPDW Moving comb spine delta width 0.125<br />
MCTHDY Moving comb tooth delta y-position 0.125<br />
SCTH1DL Static comb tooth 1 delta length 0.125<br />
SCTH1DW Static comb tooth 1 delta width 0.125<br />
SCTH1DY Static comb tooth 1 delta y-position 0.125<br />
SCTH2DL Static comb tooth 2 delta length 0.125<br />
SCTH2DW Static comb tooth 2 delta width 0.125<br />
SCTH2DY Static comb tooth 2 delta y-position 0.125<br />
SCSPDW Static comb spine delta width 0.125<br />
GPDX Ground plane delta length 0.125<br />
POLY_DT Polysilicon delta thickness 0.01<br />
Z_GAPDZ Polysilicon above nitride delta height 0.01<br />
Table 1: Uncertain input variables in the tooth<br />
model<br />
There are various probabilistic methods available in<br />
the literature, and several of them have been implemented<br />
in <strong>ANSYS</strong>/PDS. For this example, the Latin Hypercube<br />
Sampling techniques have been used.<br />
To demonstrate the use of probabilistic methods to<br />
guide the design process of a MEMS device to achieve a<br />
more reliable and robust design, 270 Monte Carlo sim-<br />
ulations were run at a stroke of 6 µm. The resulting<br />
Statistics Force<br />
Mean value 1.5792e-2<br />
Standard deviation 6.6248e-4<br />
Sample minimum 1.4062e-2<br />
Sample maximum 1.7902e-2<br />
Table 2: Statistics of the electrostatic force<br />
<strong>ANSYS</strong> Solutions www.ansys.com<br />
21
<strong>ANSYS</strong> Solutions<br />
Figure 5: Histogram of<br />
the electrostatic force<br />
Figure 6: Probability<br />
curve of the electrostatic<br />
force<br />
statistics of the electrostatic force are given in Table 2.<br />
In response to question 1 listed in the introduction,<br />
the histogram of the electrostatic force is shown in Figure<br />
5. It illustrates the scatter induced in the output pa-<br />
rameter due to the scatter of the input variables.<br />
Products are typically designed such that certain de-<br />
sign criteria, based on the output parameters, are fulfilled.<br />
Here, a good tooth design is one, where the force,<br />
F, remains <strong>with</strong>in a small range. Hence, the failure<br />
probability of the device is given by the probability that<br />
the force, F, falls outside that range. To answer question<br />
2 concerning the failure probability, the <strong>ANSYS</strong>/PDS<br />
provides cumulative distribution curves (Figure 6).<br />
The black center line is the probability, P , that the<br />
force remains lower than a certain limit value, F-limit.<br />
The complement, 1.0-P, is the probability that the force,<br />
F, exceeds this limit. The upper and lower curves in Figure<br />
6 quantify the accuracy of the probability results.<br />
If the reliability of the device is not sufficient, then<br />
question 3 from the introduction must be answered, i.e.,<br />
which input variables should be addressed to improve<br />
the quality? The answer can be derived from probabilistic<br />
sensitivity diagrams and scatter plots. To display the sensitivities,<br />
<strong>ANSYS</strong>/PDS sorts the input parameters into two<br />
groups, namely those having a significant influence on<br />
the output parameters and those being insignificant.<br />
Figure 7 shows the sensitivities of only the significant<br />
input variables. There are two important conclusions<br />
that can be derived from sensitivity diagrams.<br />
First, if the design is not sufficient, then the most im-<br />
portant input variables must be modified or better controlled.<br />
There is no point in focusing on input variables<br />
of little or no importance. Here, the force is sensitive to<br />
only three input variables. This is a reduction of the<br />
problem complexity from 14 input variables down to 3.<br />
22 Volume 2, Number 2 <strong>ANSYS</strong> Solutions<br />
Figure 7: Sensitivities of the electrostatic<br />
force, F<br />
This complexity reduction ensures that necessary<br />
design changes are identified in the most efficient way.<br />
Second, if the design is satisfactory, there is usually<br />
the need to reduce the manufacturing costs <strong>with</strong>out sacrificing<br />
reliability or quality. In this case, the manufacturing<br />
tolerances of the insignificant or the less impor-<br />
tant input parameters can be relaxed or expensive<br />
quality assurance measures for them can be reduced.<br />
If, for example, the electrostatic force should be<br />
modified, then the question remains how this could be<br />
done. A scatter plot of the electrostatic force as a function<br />
of the parameter MCTHDW can be used to answer<br />
this question (Figure 8). The trendline describes the<br />
amount of scatter in the force due to the scatter of<br />
MCTHDW. The trendline can be used to estimate to what<br />
extent the scatter of the force might be reduced if the<br />
scatter of MCTHDW is reduced.<br />
Figure 8: Electrostatic force, F, as a function<br />
of MCTHDW<br />
Conclusions<br />
“A probabilistic design approach cannot be realized<br />
<strong>with</strong> a single analysis,” as G. Deleonardo points out in<br />
the abovementioned article. However, the above<br />
example illustrates that the additional computational<br />
effort is well rewarded. A probabilistic analysis<br />
provides a wealth of information that otherwise cannot<br />
be discovered. A probabilistic analysis helps the users<br />
to better understand the behavior of a product under<br />
real-life conditions and to efficiently derive measures<br />
for quality improvement and cost reductions in an<br />
automated way. It helps the users to get closer to what<br />
their analysis work ultimately gets benchmarked<br />
against – real life.