anisotropic plasticity and failure prediction in wood ... - ANSYS Users
anisotropic plasticity and failure prediction in wood ... - ANSYS Users
anisotropic plasticity and failure prediction in wood ... - ANSYS Users

Create successful ePaper yourself
Turn your PDF publications into a flip-book with our unique Google optimized e-Paper software.
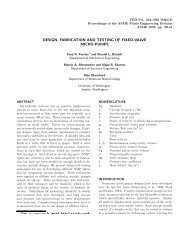
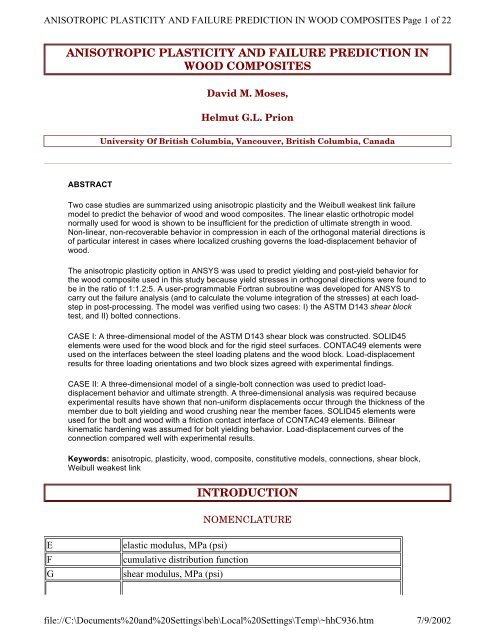
ANISOTROPIC PLASTICITY AND FAILURE PREDICTION IN WOOD COMPOSITES Page 1 of 22<br />
ANISOTROPIC PLASTICITY AND FAILURE PREDICTION IN<br />
WOOD COMPOSITES<br />
ABSTRACT<br />
David M. Moses,<br />
Helmut G.L. Prion<br />
University Of British Columbia, Vancouver, British Columbia, Canada<br />
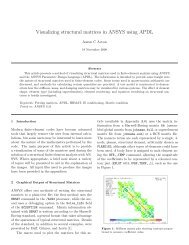
Two case studies are summarized us<strong>in</strong>g <strong>anisotropic</strong> <strong>plasticity</strong> <strong>and</strong> the Weibull weakest l<strong>in</strong>k <strong>failure</strong><br />
model to predict the behavior of <strong>wood</strong> <strong>and</strong> <strong>wood</strong> composites. The l<strong>in</strong>ear elastic orthotropic model<br />
normally used for <strong>wood</strong> is shown to be <strong>in</strong>sufficient for the <strong>prediction</strong> of ultimate strength <strong>in</strong> <strong>wood</strong>.<br />
Non-l<strong>in</strong>ear, non-recoverable behavior <strong>in</strong> compression <strong>in</strong> each of the orthogonal material directions is<br />
of particular <strong>in</strong>terest <strong>in</strong> cases where localized crush<strong>in</strong>g governs the load-displacement behavior of<br />
<strong>wood</strong>.<br />
The <strong>anisotropic</strong> <strong>plasticity</strong> option <strong>in</strong> <strong>ANSYS</strong> was used to predict yield<strong>in</strong>g <strong>and</strong> post-yield behavior for<br />
the <strong>wood</strong> composite used <strong>in</strong> this study because yield stresses <strong>in</strong> orthogonal directions were found to<br />
be <strong>in</strong> the ratio of 1:1.2:5. A user-programmable Fortran subrout<strong>in</strong>e was developed for <strong>ANSYS</strong> to<br />
carry out the <strong>failure</strong> analysis (<strong>and</strong> to calculate the volume <strong>in</strong>tegration of the stresses) at each loadstep<br />
<strong>in</strong> post-process<strong>in</strong>g. The model was verified us<strong>in</strong>g two cases: I) the ASTM D143 shear block<br />
test, <strong>and</strong> II) bolted connections.<br />
CASE I: A three-dimensional model of the ASTM D143 shear block was constructed. SOLID45<br />
elements were used for the <strong>wood</strong> block <strong>and</strong> for the rigid steel surfaces. CONTAC49 elements were<br />
used on the <strong>in</strong>terfaces between the steel load<strong>in</strong>g platens <strong>and</strong> the <strong>wood</strong> block. Load-displacement<br />
results for three load<strong>in</strong>g orientations <strong>and</strong> two block sizes agreed with experimental f<strong>in</strong>d<strong>in</strong>gs.<br />
CASE II: A three-dimensional model of a s<strong>in</strong>gle-bolt connection was used to predict loaddisplacement<br />
behavior <strong>and</strong> ultimate strength. A three-dimensional analysis was required because<br />
experimental results have shown that non-uniform displacements occur through the thickness of the<br />
member due to bolt yield<strong>in</strong>g <strong>and</strong> <strong>wood</strong> crush<strong>in</strong>g near the member faces. SOLID45 elements were<br />
used for the bolt <strong>and</strong> <strong>wood</strong> with a friction contact <strong>in</strong>terface of CONTAC49 elements. Bil<strong>in</strong>ear<br />
k<strong>in</strong>ematic harden<strong>in</strong>g was assumed for bolt yield<strong>in</strong>g behavior. Load-displacement curves of the<br />
connection compared well with experimental results.<br />
Keywords: <strong>anisotropic</strong>, <strong>plasticity</strong>, <strong>wood</strong>, composite, constitutive models, connections, shear block,<br />
Weibull weakest l<strong>in</strong>k<br />
E elastic modulus, MPa (psi)<br />
INTRODUCTION<br />
NOMENCLATURE<br />
F cumulative distribution function<br />
G shear modulus, MPa (psi)<br />
file://C:\Documents%20<strong>and</strong>%20Sett<strong>in</strong>gs\beh\Local%20Sett<strong>in</strong>gs\Temp\~hhC936.htm<br />
7/9/2002
ANISOTROPIC PLASTICITY AND FAILURE PREDICTION IN WOOD COMPOSITES Page 2 of 22<br />
I <strong>in</strong>tegral function<br />
[J] Jacobian<br />
K normalization parameter, MPa 2 , (psi 2 )<br />
K IC , K IIC<br />
fracture toughness, MN/m 3/2 (ksiv<strong>in</strong>)<br />
[M] describes yield surface<br />
N number of <strong>in</strong>tegration po<strong>in</strong>ts<br />
{N} shape functions<br />
P load, kN (lbs)<br />
W weight<strong>in</strong>g value for Gauss <strong>in</strong>tegration<br />
d diameter, mm (<strong>in</strong>.)<br />
k shape parameter of Weibull distribution<br />
l length, mm (<strong>in</strong>.)<br />
m scale parameter of Weibull distribution<br />
p probability level<br />
w width, mm (<strong>in</strong>.)<br />
x, y, z material directions <strong>in</strong> global co-ord<strong>in</strong>ates<br />
ratio of true ultimate stress to assumed<br />
coefficient of friction<br />
stress or normal stress, MPa (psi)<br />
shear stress, MPa (psi)<br />
, , normalized local co-ord<strong>in</strong>ates<br />
Subscripts<br />
i, j, r counters<br />
x, y, z, q material directions<br />
1, 2, ... counters<br />
+,- tension, compression<br />
Superscripts<br />
* reference value<br />
Few constitutive models for l<strong>in</strong>ear <strong>and</strong> non-l<strong>in</strong>ear stress-stra<strong>in</strong> behavior exist for <strong>wood</strong>. F<strong>in</strong>d<strong>in</strong>g a suitable material<br />
model for <strong>wood</strong> will allow analysts to predict its behavior <strong>in</strong> numerous applications <strong>in</strong> structural eng<strong>in</strong>eer<strong>in</strong>g<br />
without the reliance on extensive empirical tests. Such a model would represent the true stress-stra<strong>in</strong> behavior of<br />
<strong>wood</strong> <strong>and</strong> lead to <strong>prediction</strong>s of ultimate strength for numerous applications such as the behavior of connections<br />
<strong>in</strong> solid <strong>wood</strong> <strong>and</strong> <strong>in</strong> <strong>wood</strong> composites. In addition, the development of <strong>wood</strong> composites will benefit from<br />
model<strong>in</strong>g through the <strong>prediction</strong> of the effects of modified lay-ups on stress-stra<strong>in</strong> <strong>and</strong> ultimate strength<br />
characteristics.<br />
The focus of this paper is the development <strong>and</strong> verification of one such model which has been proposed for use<br />
with bolted connections <strong>in</strong> solid lumber <strong>and</strong> lam<strong>in</strong>ated str<strong>and</strong> lumber (a <strong>wood</strong> composite panel product). Wood<br />
composite panels for structural applications tend to be similar to solid <strong>wood</strong> <strong>in</strong> structure but have improved<br />
strength properties which are associated with less variability than solid <strong>wood</strong>. The structure of solid <strong>wood</strong> is,<br />
therefore, the basis for its material models.<br />
file://C:\Documents%20<strong>and</strong>%20Sett<strong>in</strong>gs\beh\Local%20Sett<strong>in</strong>gs\Temp\~hhC936.htm<br />
7/9/2002
ANISOTROPIC PLASTICITY AND FAILURE PREDICTION IN WOOD COMPOSITES Page 3 of 22<br />
Wood structure <strong>and</strong> material behavior<br />
In a tree, cells are oriented with their long axes parallel to the height of the tree. Each year, a layer of <strong>wood</strong> cells,<br />
known as the annual r<strong>in</strong>g, is added directly below the bark. The result is a difference <strong>in</strong> properties parallel to the<br />
long axis, <strong>and</strong> perpendicular to this axis, thereby mak<strong>in</strong>g this an <strong>anisotropic</strong> material. Property differences<br />
between the radial <strong>and</strong> tangential directions (relative to the core of a log) have resulted <strong>in</strong> <strong>wood</strong> be<strong>in</strong>g classified<br />
as a radially orthotropic material especially with respect to <strong>in</strong>dividual pieces of lumber cut from a log.<br />
Values of elastic <strong>and</strong> shear moduli are very different <strong>in</strong> each of the three orthotropic directions. Douglas fir, for<br />
example, has a ratio of elastic moduli <strong>in</strong> each of the primary directions of roughly 1:1.5:18 where the highest<br />
stiffness is <strong>in</strong> the direction parallel-to-gra<strong>in</strong>. The ratio for shear moduli <strong>in</strong> each of the primary shear planes is<br />
approximately 1:12:15. Large variations <strong>in</strong> these ratios exist between species. Stress-stra<strong>in</strong> behavior is non-l<strong>in</strong>ear<br />
<strong>in</strong> compression due to crush<strong>in</strong>g of cells <strong>and</strong> separation of fibers. In tension, however, stress-stra<strong>in</strong> is l<strong>in</strong>ear until<br />
brittle <strong>failure</strong> occurs. The same is true of shear. Ultimate tension strength can be more than twenty times greater<br />
parallel-to-gra<strong>in</strong> than perpendicular-to-gra<strong>in</strong>, whereas compression strength perpendicular-to-gra<strong>in</strong> can be more<br />
than three times greater than parallel-to-gra<strong>in</strong> strength. Wood composites can be manufactured to modify these<br />
properties through the orientation of fibers <strong>and</strong> the use of multiple layers.<br />
Lam<strong>in</strong>ated Str<strong>and</strong> Lumber (LSL)<br />
Lam<strong>in</strong>ated str<strong>and</strong> lumber is a composite structural material consist<strong>in</strong>g of oriented Aspen flakes, glued <strong>and</strong><br />
compressed to form panels up to 90 mm (3 1/2 <strong>in</strong>ches) thick. This material is an attractive alternative to solid<br />
sawn lumber because it has stronger properties than solid lumber of the same species as well as less variability.<br />
It can be produced from smaller diameter low quality trees thereby reduc<strong>in</strong>g our dependence on old growth<br />
forests. LSL can be produced to specific f<strong>in</strong>al properties by controll<strong>in</strong>g variables related to the str<strong>and</strong>ed lumber,<br />
res<strong>in</strong>s, <strong>and</strong> press<strong>in</strong>g cycle. As the properties of the material are improved, efficiency <strong>in</strong> design of structures us<strong>in</strong>g<br />
LSL is limited only by the capacity of these <strong>wood</strong> members at their connections to other structural components.<br />
This limitation currently results <strong>in</strong> very conservative build<strong>in</strong>g designs that do not utilize the maximum strength<br />
capacity of the members. Improvements <strong>in</strong> this area can only be achieved with a comprehensive stress analysis<br />
of the material at its connections with other members.<br />
Aspen LSL was used for this study. The size of each str<strong>and</strong> was approximately 30.5 cm (12 <strong>in</strong>ches) long, 2.5 cm<br />
(1 <strong>in</strong>ch) wide, <strong>and</strong> less than 1 mm (0.037 <strong>in</strong>ches) thick. Highly oriented panels were produced specifically for this<br />
study. An extensive series of tests were performed to determ<strong>in</strong>e the elastic properties <strong>and</strong> ultimate strengths <strong>in</strong><br />
tension <strong>and</strong> compression, as shown <strong>in</strong> Table 1. The ratio of elastic moduli was approximately 1:7:130 while the<br />
ratio of ultimate strengths <strong>in</strong> each direction was roughly 1:95:411 <strong>in</strong> compression <strong>and</strong> 1:4:39 <strong>in</strong> tension. These<br />
large ratios <strong>in</strong>dicate the highly orthotropic nature of this material. Shear moduli were not measured <strong>in</strong> this study<br />
but can be assumed from previous studies (Hunt et al., 1985, Hoover et al., 1992, <strong>and</strong> Bradtmueller et al., 1997),<br />
as shown <strong>in</strong> Table 2.<br />
Table 1. Properties of LSL determ<strong>in</strong>ed from experiments<br />
Tension E (psi) k<br />
m*<br />
(unit vol.)<br />
* (V=V*=1,<br />
p=0.5)<br />
No. of<br />
replicates<br />
X 95,000 4.5 747 689 30<br />
Y 1,700,000 5.7 8150 7642 30<br />
Z 13,000 6.4 207 195 30<br />
Compression E (psi) E tangent (psi) yield (psi)<br />
Avg. ultimate<br />
(psi)<br />
No. of<br />
replicates<br />
X 95,000 31,000 1020 1238 10<br />
Y 1,700,000 1,150,000 4009 5346 10<br />
file://C:\Documents%20<strong>and</strong>%20Sett<strong>in</strong>gs\beh\Local%20Sett<strong>in</strong>gs\Temp\~hhC936.htm<br />
7/9/2002
ANISOTROPIC PLASTICITY AND FAILURE PREDICTION IN WOOD COMPOSITES Page 4 of 22<br />
Z 13,000 6,000 620 - 10<br />
Shear Vol. (cu.<strong>in</strong>.)<br />
Avg. ultimate<br />
load (lbs.)<br />
Table 2. Shear properties of LSL based on studies by others<br />
Avg. ultimate<br />
displacement<br />
(<strong>in</strong>.)<br />
PREVIOUS MATERIAL MODELS<br />
Stress-stra<strong>in</strong> behavior<br />
Early analyses of orthotropic plates with p<strong>in</strong>-loaded holes emphasized the performance of contact elements on<br />
the boundary between the p<strong>in</strong> <strong>and</strong> the plate <strong>and</strong> assumed l<strong>in</strong>ear elastic properties for the plate (Wilk<strong>in</strong>son et al.,<br />
1981, Hyer et al., 1987). Rahman et al. (1991) performed a two-dimensional analysis of a p<strong>in</strong> <strong>in</strong> a hole <strong>in</strong> an<br />
orthotropic <strong>wood</strong> plate but added material non-l<strong>in</strong>earity due to crush<strong>in</strong>g of <strong>wood</strong> fibers to determ<strong>in</strong>e the stress<br />
distribution around the hole. They showed that a non-l<strong>in</strong>ear compression model parallel-to-gra<strong>in</strong> (with p<strong>in</strong> load<strong>in</strong>g<br />
parallel-to-gra<strong>in</strong>) resulted <strong>in</strong> improved stress <strong>prediction</strong>s along the region beg<strong>in</strong>n<strong>in</strong>g under the bolt <strong>and</strong> extend<strong>in</strong>g<br />
to the end of the specimen. These results corresponded to measured Moiré fr<strong>in</strong>ge patterns.<br />
Patton-Mallory et al. (1997) performed a non-l<strong>in</strong>ear elastic analysis <strong>in</strong> three-dimensions for a model of a s<strong>in</strong>gle<br />
bolt <strong>in</strong> a piece of Douglas fir. The geometry of this model is described <strong>in</strong> section 5. The tri-l<strong>in</strong>ear elastic stressstra<strong>in</strong><br />
behavior assumed for this model <strong>and</strong> shown <strong>in</strong> Figure 1 for normal stress parallel-to-gra<strong>in</strong>, resulted <strong>in</strong> very<br />
good load-displacement <strong>prediction</strong>s compared to experimental results. The crush<strong>in</strong>g of fibers parallel-to-gra<strong>in</strong><br />
most <strong>in</strong>fluenced the displacement of the bolt relative to the piece of <strong>wood</strong>, thus, the tri-l<strong>in</strong>ear model proved useful<br />
for load-displacement <strong>prediction</strong>s of connections. However, as was <strong>in</strong>dicated by Patton-Mallory et al. (1997),<br />
improvements are still required <strong>in</strong> the material model for <strong>wood</strong>.<br />
k<br />
No. of<br />
replicates<br />
XY - big 6.9 5054 0.07 10.6 15<br />
XY - small 3.2 2300 0.06 10.6 20<br />
YZ - big 6.8 2302 0.03 7.4 15<br />
YZ - big 3.4 1674 0.03 7.4 15<br />
XZ - small 6.8 1490 0.06 6.9 16<br />
XZ - small 3.4 701 0.06 6.9 14<br />
Poisson's Ratios Value<br />
No. of<br />
replicates<br />
XY 0.048 10<br />
YZ 0.993 10<br />
XZ 0.351 10<br />
Interlam<strong>in</strong>ar Shear<br />
G YZ parallel (psi) 61,000<br />
G XZ perpendicular (psi) 26,000<br />
Edgewise Shear<br />
G XY (psi) 200,000<br />
file://C:\Documents%20<strong>and</strong>%20Sett<strong>in</strong>gs\beh\Local%20Sett<strong>in</strong>gs\Temp\~hhC936.htm<br />
7/9/2002
ANISOTROPIC PLASTICITY AND FAILURE PREDICTION IN WOOD COMPOSITES Page 5 of 22<br />
Two drawbacks were associated with the tri-l<strong>in</strong>ear elastic model. Firstly, at high stra<strong>in</strong>s, negative terms were<br />
found to develop on the ma<strong>in</strong> diagonal of the stiffness matrix if similar tri-l<strong>in</strong>ear elastic behavior was used <strong>in</strong> the<br />
two other orthotropic material directions <strong>in</strong> compression. As a result, non-l<strong>in</strong>earity <strong>in</strong> the shear stress-stra<strong>in</strong><br />
behavior was <strong>in</strong>troduced to improve the numerical stability of the model. Secondly, the <strong>prediction</strong> of stresses <strong>in</strong><br />
the perpendicular-to-gra<strong>in</strong> directions was <strong>in</strong>accurate, as discussed by Moses <strong>and</strong> Prion (1999), which meant that<br />
ultimate strength of the connection could not be well predicted. Part of the problem with the elastic model was its<br />
<strong>in</strong>ability to account for the energy dissipation associated with the non-recoverable deformations due to <strong>wood</strong><br />
crush<strong>in</strong>g. Plasticity models prevent this form of <strong>in</strong>stability from occurr<strong>in</strong>g. For the current study, it was proposed<br />
that the behavior <strong>in</strong> compression be modeled with the <strong>anisotropic</strong> <strong>plasticity</strong> model, while tension <strong>and</strong> shear<br />
behavior rema<strong>in</strong> l<strong>in</strong>ear elastic, until reach<strong>in</strong>g ultimate <strong>failure</strong>.<br />
Figure 1. TRI-LINEAR STRESS-STRAIN CURVE FOR COMPRESSION BEHAVIOR PARALLEL-TO-GRAIN<br />
Failure behavior<br />
Wood is brittle <strong>in</strong> tension <strong>and</strong> shear. Methods such as fracture mechanics <strong>and</strong> <strong>failure</strong> envelopes can be used to<br />
predict the po<strong>in</strong>t at which brittle <strong>failure</strong> occurs. Stress based criteria are typically used for <strong>wood</strong>.<br />
Fracture mechanics <strong>in</strong> <strong>wood</strong> can be used to predict ultimate strength <strong>in</strong> mixed-mode tension/shear stress fields. A<br />
crack can start <strong>in</strong> any direction but will always turn to the direction with the lowest fracture toughness. In <strong>wood</strong>,<br />
this is normally the direction along the gra<strong>in</strong> because the fracture toughness <strong>in</strong> other directions is approximately<br />
ten times greater. There is, however, some question about the accuracy <strong>in</strong> the determ<strong>in</strong>ation of the fracture<br />
toughness constants K IC <strong>and</strong> K IIC for mixed-mode <strong>failure</strong> <strong>in</strong> <strong>wood</strong> (Fonselius <strong>and</strong> Riipola 1992). In addition to<br />
difficulties <strong>in</strong> determ<strong>in</strong><strong>in</strong>g the fracture toughness constants, there is little <strong>in</strong>formation available on more complex<br />
criteria for three-dimensional mixed-mode stress cases. To simplify the model<strong>in</strong>g <strong>and</strong> solution processes, <strong>and</strong><br />
reduce the number of tests required to determ<strong>in</strong>e strength parameters, the theory of fracture mechanics was not<br />
selected for the current study.<br />
The Maximum Stress criterion is assumed for the current study. Ultimate strengths <strong>in</strong> tension <strong>and</strong> shear are<br />
predicted us<strong>in</strong>g the Weibull weakest l<strong>in</strong>k theory for size effects, while the <strong>plasticity</strong> model allows for <strong>in</strong>creas<strong>in</strong>g<br />
stra<strong>in</strong>s <strong>in</strong> compression beyond the assigned yield stresses. Tensor polynomial criteria such as the Tsai-Wu (Tsai<br />
<strong>and</strong> Wu 1971) criterion can be used to relate ultimate strengths <strong>in</strong> tension, compression <strong>and</strong> shear to the current<br />
state of stress <strong>in</strong> two-dimensional models of composites. In three-dimensions, however, the determ<strong>in</strong>ation of the<br />
<strong>in</strong>teraction terms required for this model can be difficult or impossible if all stress comb<strong>in</strong>ations are considered.<br />
CURRENT MODEL<br />
Anisotropic Plasticity<br />
The <strong>anisotropic</strong> <strong>plasticity</strong> material model has been used to predict <strong>failure</strong> of non-<strong>wood</strong> composites <strong>in</strong> twodimensional<br />
f<strong>in</strong>ite element models at the University of British Columbia, Canada (Vaziri 1991). In the current<br />
application, the <strong>anisotropic</strong> <strong>plasticity</strong> model was applied <strong>in</strong> three-dimensions us<strong>in</strong>g the TB,ANISO option <strong>in</strong><br />
<strong>ANSYS</strong> v.5.3. As <strong>in</strong>dicated <strong>in</strong> the <strong>ANSYS</strong> Theory Manual (<strong>ANSYS</strong> 1992), this model is based upon the yield<br />
criterion by Hill (1947) for orthotropic materials. Different compression <strong>and</strong> tension yield stresses <strong>in</strong> each direction<br />
are h<strong>and</strong>led by changes proposed by Shih <strong>and</strong> Lee (1978) <strong>and</strong> the work harden<strong>in</strong>g model of Valliappan et al.<br />
(1976). An associative flow rule is assumed. A sample stress-stra<strong>in</strong> curve is shown <strong>in</strong> Figure 2 <strong>in</strong>dicat<strong>in</strong>g the yield<br />
stress <strong>and</strong> tangent modulus for one material direction. The two other normal stress-stra<strong>in</strong> curves <strong>and</strong> three shear<br />
file://C:\Documents%20<strong>and</strong>%20Sett<strong>in</strong>gs\beh\Local%20Sett<strong>in</strong>gs\Temp\~hhC936.htm<br />
7/9/2002
ANISOTROPIC PLASTICITY AND FAILURE PREDICTION IN WOOD COMPOSITES Page 6 of 22<br />
stress-stra<strong>in</strong> curves are also required for this model. This results <strong>in</strong> eighteen additional constants beyond the n<strong>in</strong>e<br />
required for orthotropic elastic materials.<br />
Figure 2. BI-LINEAR STRESS-STRAIN CURVE FOR NORMAL STRESS IN ANISOTROPIC PLASTICITY<br />
MODEL<br />
Two criteria must be satisfied when us<strong>in</strong>g this model. To satisfy the requirement for plastic <strong>in</strong>compressibility, the<br />
yield stresses +i <strong>and</strong> -i <strong>in</strong> tension <strong>and</strong> compression, respectively, <strong>in</strong> direction i are <strong>in</strong>ter-related:<br />
(1)<br />
To ma<strong>in</strong>ta<strong>in</strong> a closed yield surface:<br />
(2)<br />
where:<br />
, (i = 1, 2, 3) (3)<br />
<strong>and</strong><br />
. (4)<br />
Equation (2) must be satisfied at all levels of stra<strong>in</strong> s<strong>in</strong>ce the yield stresses will change as work harden<strong>in</strong>g<br />
proceeds. These restrictions on allowable yield stresses <strong>and</strong> tangent moduli make fitt<strong>in</strong>g of experimental results<br />
difficult. This is particularly true for highly orthotropic materials. Mak<strong>in</strong>g the yield stresses <strong>and</strong> tangent moduli<br />
file://C:\Documents%20<strong>and</strong>%20Sett<strong>in</strong>gs\beh\Local%20Sett<strong>in</strong>gs\Temp\~hhC936.htm<br />
7/9/2002
ANISOTROPIC PLASTICITY AND FAILURE PREDICTION IN WOOD COMPOSITES Page 7 of 22<br />
more equal <strong>in</strong>creases the chances of satisfy<strong>in</strong>g these equations. Equation (1) is better satisfied if the yield<br />
stresses <strong>in</strong> tension <strong>and</strong> compression are set equal to each other for each direction. To assist <strong>in</strong> determ<strong>in</strong><strong>in</strong>g these<br />
values, a spreadsheet was developed us<strong>in</strong>g an optimization algorithm to satisfy these conditions up to 20%<br />
plastic stra<strong>in</strong>.<br />
The fitted stress-stra<strong>in</strong> curves assumed for LSL <strong>in</strong> each direction <strong>in</strong> compression are shown <strong>in</strong> Figure 3 along with<br />
experimental uniaxial stress-stra<strong>in</strong> curves. Values for the model are listed <strong>in</strong> Table 3. It was found that equations<br />
(1) <strong>and</strong> (2) were best satisfied when tension <strong>and</strong> compression yield stresses were set equal for each direction of<br />
normal stress. The shear yield stress was set high to prevent yield<strong>in</strong>g <strong>in</strong> shear. At this po<strong>in</strong>t, it was assumed that<br />
tension behavior would be allowed to follow the bi-l<strong>in</strong>ear stress-stra<strong>in</strong> curve with yield<strong>in</strong>g. This is possible s<strong>in</strong>ce<br />
brittle <strong>failure</strong> <strong>in</strong> tension will occur below the yield po<strong>in</strong>t <strong>in</strong> the critical X <strong>and</strong> Z directions for the two cases<br />
discussed <strong>in</strong> this paper.<br />
Table 3. Properties used <strong>in</strong> model for normal stresses<br />
Direction E (psi) E tangent (psi) yield (psi)<br />
X 95,000 4452 960<br />
Y 1,700,000 50,000 3500<br />
Z 13,000 3617 810<br />
Figure 3. STRESS-STRAIN EXPERIMENTAL CURVES FOR COMPRESSION BEHAVIOR SHOWING<br />
ASSUMED ANISOTROPIC PLASTICITY CURVES.<br />
(Y-DIRECTION IS PARALLEL TO AXIS OF GRAIN)<br />
file://C:\Documents%20<strong>and</strong>%20Sett<strong>in</strong>gs\beh\Local%20Sett<strong>in</strong>gs\Temp\~hhC936.htm<br />
7/9/2002
ANISOTROPIC PLASTICITY AND FAILURE PREDICTION IN WOOD COMPOSITES Page 8 of 22<br />
Size Effects<br />
The Weibull weakest l<strong>in</strong>k theory postulates that for brittle materials, larger specimens are more likely to fail at<br />
lower stresses due to the <strong>in</strong>creased probability of a flaw <strong>in</strong> that larger specimen volume. Barrett (1974) found this<br />
to be true for the ultimate tension stress perpendicular-to-gra<strong>in</strong> <strong>in</strong> Douglas fir. This concept was used to develop<br />
lumber strength design values for the Canadian st<strong>and</strong>ard for Eng<strong>in</strong>eer<strong>in</strong>g Design <strong>in</strong> Wood (O86.1, 1995). It has<br />
also been used to determ<strong>in</strong>e the strength of timber rivet connections listed <strong>in</strong> the st<strong>and</strong>ard (Foschi <strong>and</strong> Longworth,<br />
1975).<br />
The probability of brittle <strong>failure</strong> based on a two-parameter Weibull distribution is a function of the stress<br />
distribution over the volume of material:<br />
file://C:\Documents%20<strong>and</strong>%20Sett<strong>in</strong>gs\beh\Local%20Sett<strong>in</strong>gs\Temp\~hhC936.htm<br />
7/9/2002
ANISOTROPIC PLASTICITY AND FAILURE PREDICTION IN WOOD COMPOSITES Page 9 of 22<br />
(5)<br />
where F is the probability of <strong>failure</strong>, V* is a reference volume, k is the shape parameter, m is the scale parameter<br />
associated with the reference volume, <strong>and</strong> is the stress (tension or shear, <strong>in</strong> any given direction or plane,<br />
respectively). The reference stress is based on experimental results shown <strong>in</strong> Table 1.<br />
(6)<br />
is the <strong>failure</strong> stress for a given probability of <strong>failure</strong>, p. It can be shown that <strong>failure</strong> occurs when the reference<br />
stress, *, occurr<strong>in</strong>g over volume V*, satisfies the follow<strong>in</strong>g <strong>in</strong>equality which relates a variable state of stress over<br />
an arbitrary volume to the reference stress:<br />
(7)<br />
This form is similar to the Maximum Stress criterion where each stress is treated <strong>in</strong>dividually <strong>and</strong> stress<br />
<strong>in</strong>teractions are assumed to have little or no effect. When the stress field is constant over a volume, equation (7)<br />
can be simplified to give the <strong>failure</strong> stresses for a given probability level, p:<br />
(8)<br />
where 1 <strong>and</strong> 2 are the strengths of specimens of volumes, V 1 <strong>and</strong> V 2 , respectively.<br />
This theory was implemented <strong>in</strong> <strong>ANSYS</strong> with a user-programmable comm<strong>and</strong> user01.f to execute the modified<br />
userac.f subrout<strong>in</strong>e that calculated stresses <strong>in</strong> <strong>wood</strong> <strong>in</strong> the post-processor. The follow<strong>in</strong>g algorithm for calculat<strong>in</strong>g<br />
the volume <strong>in</strong>tegral <strong>in</strong> equation (7) was carried out at each load-step <strong>in</strong> the post-processor to determ<strong>in</strong>e when or if<br />
<strong>failure</strong> occurred. At each load step, this algorithm was applied to each of the three normal tensile stresses <strong>and</strong><br />
each of the three shear stresses. In this way, the govern<strong>in</strong>g mode of <strong>failure</strong> could be determ<strong>in</strong>ed.<br />
The volume <strong>in</strong>tegral, I:<br />
(9)<br />
must be evaluated for each three-dimensional brick element (SOLID45) us<strong>in</strong>g Gaussian <strong>in</strong>tegration. Volume, V, <strong>in</strong><br />
the global co-ord<strong>in</strong>ate system (x,y,z), for each element is def<strong>in</strong>ed, <strong>in</strong> terms of the local (normalized) element co-<br />
ord<strong>in</strong>ate system ( , , ):<br />
file://C:\Documents%20<strong>and</strong>%20Sett<strong>in</strong>gs\beh\Local%20Sett<strong>in</strong>gs\Temp\~hhC936.htm<br />
7/9/2002
ANISOTROPIC PLASTICITY AND FAILURE PREDICTION IN WOOD COMPOSI...<br />
(10)<br />
The partial derivative of volume, dV:<br />
(11)<br />
where [J] is the Jacobian. Comb<strong>in</strong><strong>in</strong>g equations (9) <strong>and</strong> (11):<br />
(12)<br />
<strong>in</strong> local co-ord<strong>in</strong>ates. The determ<strong>in</strong>ant of [J] is equal to the volume of the element <strong>in</strong> global co-ord<strong>in</strong>ates <strong>and</strong> is<br />
calculated from the nodal coord<strong>in</strong>ates <strong>and</strong> the derivatives of shape functions {N}:<br />
for i = 1, 2,. . ., 8 (13)<br />
For Gaussian <strong>in</strong>tegration, (12) is re-written <strong>in</strong> terms of stresses evaluated at each Gauss po<strong>in</strong>t, i, multiplied by the<br />
appropriate Gauss weight<strong>in</strong>g values, W i . From (12) we get the approximate Gauss evaluation of the <strong>in</strong>tegral:<br />
(14)<br />
A 2x2x2 (8-po<strong>in</strong>t) <strong>in</strong>tegration scheme is used for the SOLID45 elements. The stresses at one Gauss po<strong>in</strong>t are<br />
determ<strong>in</strong>ed:<br />
(15)<br />
file://C:\Documents%20<strong>and</strong>%20Sett<strong>in</strong>gs\beh\Local%20Sett<strong>in</strong>gs\Temp\~hhC936.htm<br />
Page 10 of 22<br />
7/9/2002
ANISOTROPIC PLASTICITY AND FAILURE PREDICTION IN WOOD COMPOSI...<br />
Comb<strong>in</strong><strong>in</strong>g (14) <strong>and</strong> (15):<br />
(16)<br />
Equation (16) is determ<strong>in</strong>ed for each element <strong>and</strong> then summed for all elements. The total is equal to the volume<br />
<strong>in</strong>tegral over the entire model geometry <strong>in</strong> global co-ord<strong>in</strong>ates. The operation is repeated for each stress<br />
component <strong>and</strong> k value. Accuracy is dependent on the number of <strong>in</strong>tegration po<strong>in</strong>ts, N, <strong>and</strong> is ensured if the order<br />
of the <strong>in</strong>tegral is less than 2N-1. The 2x2x2 po<strong>in</strong>t scheme can be used for larger values of k provided that the<br />
number of elements is <strong>in</strong>creased <strong>in</strong> regions of high stress gradients.<br />
CASE STUDY I - WOOD SHEAR BLOCKS<br />
The ASTM D143 (1991) shear block test has been used for many decades to characterize the shear strength of<br />
solid <strong>wood</strong> parallel-to-gra<strong>in</strong>. The block, shown <strong>in</strong> Figure 4, is placed <strong>in</strong>to a steel test frame which applies a load<br />
onto the notched surface of the <strong>wood</strong> shear block, effectively shear<strong>in</strong>g the notched portion of the block relative to<br />
the ma<strong>in</strong> block body until the specimen fails. The load at <strong>failure</strong> is used as an estimate of ultimate shear strength<br />
<strong>in</strong> this plane where the nom<strong>in</strong>al shear strength, nom<strong>in</strong>al , is assumed to be equal to the ultimate load, P maximum ,<br />
divided by the shear area, l x w. This test specimen has been criticized, however, for fail<strong>in</strong>g prematurely due to: a)<br />
the non-uniform stress distribution over the <strong>failure</strong> plane, <strong>and</strong> b) the stress concentration caused by the presence<br />
of the notch. As a result, shear strengths determ<strong>in</strong>ed from this test have been shown to be lower than the actual<br />
shear strength of <strong>wood</strong>.<br />
Figure 4. ASTM D143 SHEAR BLOCK<br />
Page 11 of 22<br />
Shear blocks for this study were cut accord<strong>in</strong>g to ASTM D143 <strong>in</strong> the three orientations XY, YZ, <strong>and</strong> XZ, as shown<br />
<strong>in</strong> Figure 5. The long axis of the oriented str<strong>and</strong>s runs parallel to the Y-direction. The XY orientation is equivalent<br />
to the edgewise panel shear orientation where pure shear <strong>failure</strong> is unlikely to occur. The YZ orientation is<br />
equivalent to <strong>in</strong>terlam<strong>in</strong>ar shear parallel-to the ma<strong>in</strong> str<strong>and</strong> axis. The XZ orientation is equivalent to <strong>in</strong>terlam<strong>in</strong>ar<br />
shear perpendicular-to the ma<strong>in</strong> str<strong>and</strong> axis. The 38 mm (1 1/2 <strong>in</strong>ch) panel thickness restricted the dimensions <strong>in</strong><br />
the Z-direction, as <strong>in</strong>dicated <strong>in</strong> the figure. In addition to load measurements, displacement of the load<strong>in</strong>g platen<br />
was recorded dur<strong>in</strong>g the tests for comparison to model results. Two specimen sizes were tested <strong>in</strong> each<br />
orientation to determ<strong>in</strong>e if the size effect <strong>in</strong> shear could be measured. This resulted <strong>in</strong> six types of shear block<br />
specimens.<br />
file://C:\Documents%20<strong>and</strong>%20Sett<strong>in</strong>gs\beh\Local%20Sett<strong>in</strong>gs\Temp\~hhC936.htm<br />
7/9/2002
ANISOTROPIC PLASTICITY AND FAILURE PREDICTION IN WOOD COMPOSI...<br />
Figure 5. SHEAR BLOCK ORIENTATIONS AND DIMENSIONS.<br />
(Y-DIRECTION IS PARALLEL-TO-GRAIN, Z-DIRECTION IS PERPENDICULAR TO PANEL<br />
SURFACE.)<br />
The f<strong>in</strong>ite element model was created to determ<strong>in</strong>e: a) the effectiveness of the <strong>anisotropic</strong> <strong>plasticity</strong> model, b) the<br />
shear strength constants for the Weibull weakest l<strong>in</strong>k theory, c) the stress distribution along the shear plane, <strong>and</strong><br />
d) the effect of the stress concentration. SOLID45 brick elements were used to model the shear block <strong>in</strong> <strong>ANSYS</strong>.<br />
The geometry <strong>and</strong> boundary conditions for a s<strong>in</strong>gle shear block are shown <strong>in</strong> Figure 6. A higher mesh density was<br />
used <strong>in</strong> regions of stress concentrations. Six such models were used (one for each of the shear block sizes <strong>and</strong><br />
orientations). The steel test frame was simulated us<strong>in</strong>g rigid brick elements for the base <strong>and</strong> load<strong>in</strong>g platen. The<br />
base was restricted from mov<strong>in</strong>g <strong>in</strong> each of the three degrees of freedom, whereas the load<strong>in</strong>g platen was only<br />
allowed to move <strong>in</strong> the direction of load<strong>in</strong>g, as shown <strong>in</strong> Figure 6. Load<strong>in</strong>g was controlled by the displacement of<br />
the platen over the same ranges found <strong>in</strong> the experiments for each block type. Elements along the vertical side of<br />
the notch were on rollers, as shown <strong>in</strong> the figure, to simulate the presence of the platen. Rollers were placed on<br />
the back side of the specimen to simulate the presence of the support<strong>in</strong>g back plate, as <strong>in</strong>dicated <strong>in</strong> Figure 6. The<br />
entire model is only half of the actual shear block (us<strong>in</strong>g appropriate boundary conditions along the plane of<br />
symmetry of the specimen), thereby reduc<strong>in</strong>g the model size.<br />
Figure 6. SHEAR BLOCK MODEL GEOMETRY<br />
file://C:\Documents%20<strong>and</strong>%20Sett<strong>in</strong>gs\beh\Local%20Sett<strong>in</strong>gs\Temp\~hhC936.htm<br />
Page 12 of 22<br />
7/9/2002
ANISOTROPIC PLASTICITY AND FAILURE PREDICTION IN WOOD COMPOSI...<br />
Surface-to-po<strong>in</strong>t CONTAC49 elements were used for the <strong>in</strong>terfaces between the steel frame <strong>and</strong> the <strong>wood</strong><br />
specimen at the two locations shown <strong>in</strong> Figure 6. The contact elements allow for gaps to form between the steel<br />
<strong>and</strong> the <strong>wood</strong> block as the block rotates under load. At the load<strong>in</strong>g platen <strong>in</strong>terface, it has been postulated that<br />
normal stresses, perpendicular-to the shear plane, may <strong>in</strong>fluence the <strong>failure</strong> behavior (Liu, 1984). Thus, <strong>in</strong><br />
addition to the contact surface, friction between the steel <strong>and</strong> <strong>wood</strong> was <strong>in</strong>cluded with a coefficient of friction for<br />
slid<strong>in</strong>g of = 0.7.<br />
CASE I - Results<br />
A sample set of experimental load-displacement curves is shown <strong>in</strong> Figure 7 along with the correspond<strong>in</strong>g curve<br />
produced by the model adjusted to account for <strong>in</strong>itial seat<strong>in</strong>g of the specimens. The predicted behavior was close<br />
to that observed <strong>in</strong> the experiments. The displacements shown <strong>in</strong> the figure were due to a comb<strong>in</strong>ation of<br />
compression <strong>and</strong> shear deformations. Compression properties were found to dom<strong>in</strong>ate the load-displacement<br />
behavior.<br />
Figure 7. SAMPLE EXPERIMENTAL LOAD-DISPLACEMENT CURVES FOR SHEAR BLOCKS WITH<br />
PREDICTED CURVES FROM <strong>ANSYS</strong><br />
file://C:\Documents%20<strong>and</strong>%20Sett<strong>in</strong>gs\beh\Local%20Sett<strong>in</strong>gs\Temp\~hhC936.htm<br />
Page 13 of 22<br />
7/9/2002
ANISOTROPIC PLASTICITY AND FAILURE PREDICTION IN WOOD COMPOSI...<br />
Failure <strong>in</strong> the models is assumed to occur at the f<strong>in</strong>al displacement level measured <strong>in</strong> the experiments. S<strong>in</strong>ce this<br />
<strong>failure</strong> is assumed to have occurred <strong>in</strong> shear, the reference shear stress, *, shown <strong>in</strong> Table 4, was determ<strong>in</strong>ed<br />
at that f<strong>in</strong>al load step us<strong>in</strong>g equations (7) <strong>and</strong> (16). The average values of * for each plane will be taken as the<br />
actual reference strength for this material. Thus, the shear strengths XY, YZ <strong>and</strong> XZ are (3098+2817)/2 = 2958<br />
psi, (1022+1386)/2 = 1204 psi, <strong>and</strong> (893+669)/2 = 781 psi, respectively. The strength values for each specimen<br />
type are compared aga<strong>in</strong>st the average nom<strong>in</strong>al ultimate shear stresses <strong>in</strong> Table 4. The ratio of these values, ,<br />
<strong>in</strong>dicates that the actual shear stress at <strong>failure</strong> is, on average, 1.7 times greater than the assumed nom<strong>in</strong>al stress.<br />
Foschi <strong>and</strong> Barrett (1976) found the value of to be approximately two for the shear plane parallel-to-gra<strong>in</strong> <strong>in</strong><br />
Douglas fir <strong>and</strong> that was dependent on the value of the shape parameter, k.<br />
Table 4. Predicted values of shear strength<br />
Specimen<br />
*<br />
(v = 1,<br />
p = 0.5)<br />
*<br />
(v = actual vol.,<br />
p = 0.5)<br />
nom<strong>in</strong>al<br />
(from model<br />
ultimate load)<br />
XY - large 3098 2793 1603 1.7<br />
XY - small 2817 2729 1598 1.7<br />
file://C:\Documents%20<strong>and</strong>%20Sett<strong>in</strong>gs\beh\Local%20Sett<strong>in</strong>gs\Temp\~hhC936.htm<br />
Page 14 of 22<br />
=<br />
7/9/2002
ANISOTROPIC PLASTICITY AND FAILURE PREDICTION IN WOOD COMPOSI...<br />
YZ - large 1022 847 573 1.5<br />
YZ - small 1386 1262 910 1.6<br />
XZ - large 893 730 411 1.8<br />
XZ - small 669 605 344 1.8<br />
Page 15 of 22<br />
The shear stress along two sections was analyzed to determ<strong>in</strong>e the distribution of stress. Section A-B, runn<strong>in</strong>g<br />
from the notch to the bottom of the specimen along the outside of the specimen, is shown <strong>in</strong> Figure 6. Section A'-<br />
B' runs through the middle of the specimen. A prelim<strong>in</strong>ary analysis us<strong>in</strong>g this three-dimensional model, assum<strong>in</strong>g<br />
isotropic properties for the <strong>wood</strong>, <strong>in</strong>dicated that the peak stresses occurred at the notch. The stress concentration<br />
factor (peak stress divided by nom<strong>in</strong>al stress) was found to be approximately 2.0 for the shear block with the<br />
isotropic properties - this agrees with photo-elastic analysis by Coker <strong>and</strong> Coleman (1935).<br />
Figure 8 shows the typical stress distribution along the outside section A-B <strong>and</strong> the center of the specimen, A'-B',<br />
at ultimate load. The distribution is not uniform over the sections. The peak values at the notch (‘0’ <strong>in</strong>ches <strong>in</strong><br />
Figure 8) are used to determ<strong>in</strong>e the stress concentration factor. From the two curves shown <strong>in</strong> Figure 8, there<br />
does not appear to be much difference between shear stresses <strong>in</strong> the center of the specimen <strong>and</strong> those along the<br />
outside. This <strong>in</strong>dicates that a two-dimensional geometric model is probably adequate for predict<strong>in</strong>g shear stresses<br />
(but not necessarily for ultimate strength).<br />
Figure 8. SAMPLE SHEAR STRESS ALONG EXTERIOR (A-B) AND INTERIOR (A'-B') AT 100% LOADING<br />
file://C:\Documents%20<strong>and</strong>%20Sett<strong>in</strong>gs\beh\Local%20Sett<strong>in</strong>gs\Temp\~hhC936.htm<br />
7/9/2002
ANISOTROPIC PLASTICITY AND FAILURE PREDICTION IN WOOD COMPOSI...<br />
Us<strong>in</strong>g the <strong>anisotropic</strong> <strong>plasticity</strong> material model, the stress concentration factor was at least 2.0 (roughly) as<br />
<strong>in</strong>dicated <strong>in</strong> Table 5. The difference <strong>in</strong> values between the three planes may, <strong>in</strong> part, be attributed to assumed<br />
values of the shear moduli, given <strong>in</strong> Table 2. Cramer et al. (1984) <strong>in</strong>dicated that <strong>in</strong>clud<strong>in</strong>g the effects of crush<strong>in</strong>g<br />
through a non-l<strong>in</strong>ear compression stress model would result <strong>in</strong> stress concentration factors lower than their<br />
calculated value of 2.36 due to the release of stra<strong>in</strong> energy through ductile behavior. This is not always the case<br />
as shown <strong>in</strong> Table 5.<br />
Table 5. Stress concentration factors for shear blocks at ultimate load<br />
Specimen Peak stress (see Figure 8)<br />
Note: values are average peaks between sections A-B <strong>and</strong> A'-B'.<br />
It was previously mentioned that a two-dimensional model would be sufficient to determ<strong>in</strong>e the stress distribution.<br />
The current three-dimensional model can be used, however, to determ<strong>in</strong>e if brittle <strong>failure</strong> occurred <strong>in</strong> tension <strong>in</strong><br />
the X, Y or Z directions. Us<strong>in</strong>g the reference stress values determ<strong>in</strong>ed from the tension tests (shown <strong>in</strong> Table 1) at<br />
p = 0.5, it was found that delam<strong>in</strong>ation <strong>failure</strong> (tension <strong>in</strong> the Z-direction) occurred at roughly 40% of the ultimate<br />
displacement as shown <strong>in</strong> Table 6. The specimen could still carry load, as was observed <strong>in</strong> experiments, but the<br />
analysis <strong>in</strong>dicated that the tensile stress concentration <strong>in</strong> the region of the notch would produce delam<strong>in</strong>ation.<br />
Table 6. Predicted ultimate load due to shear or tension <strong>failure</strong><br />
Stress concentration factor<br />
XY - large 3531 2.2<br />
XY - small 2867 1.8<br />
YZ - large 1884 3.3<br />
YZ - small 2446 2.7<br />
XZ - large 1297 3.2<br />
XZ - small 1392 4.0<br />
Specimen Max. Load (lbs.) Max. load due to<br />
tension <strong>failure</strong> <strong>in</strong> X<br />
or Z (lbs.)<br />
Tension load/shear<br />
load<br />
XY - large 4808 1850 (Z) 0.38<br />
XY - small 2237 1200 (Z) 0.54<br />
YZ - large 2292 830 (Z) 0.36<br />
YZ - small 1820 830 (Z) 0.46<br />
XZ - large 1642 460 (X & Z) 0.28<br />
XZ - small 688 260 (X & Z) 0.38<br />
Tension <strong>failure</strong> due to delam<strong>in</strong>ation <strong>in</strong> Z-direction <strong>in</strong>dicated by (Z) <strong>and</strong> tension <strong>failure</strong> perpendicularto-gra<strong>in</strong><br />
<strong>in</strong>dicated by (X)<br />
CASE STUDY II - SINGLE-BOLT CONNECTION<br />
Page 16 of 22<br />
The performance of connections <strong>in</strong> timber is dependent on many factors <strong>in</strong>clud<strong>in</strong>g: bolt size, end distance, edge<br />
distance, member thickness, species, hole diameter, direction of load<strong>in</strong>g, <strong>and</strong> bolt yield stress. Only some of<br />
these parameters have been <strong>in</strong>cluded <strong>in</strong> early models of connections <strong>in</strong> <strong>wood</strong>. A one-dimensional f<strong>in</strong>ite element<br />
model of nails <strong>and</strong>/or rivets <strong>in</strong> timber was developed us<strong>in</strong>g cubic polynomial displacement functions <strong>and</strong> beam<br />
file://C:\Documents%20<strong>and</strong>%20Sett<strong>in</strong>gs\beh\Local%20Sett<strong>in</strong>gs\Temp\~hhC936.htm<br />
7/9/2002
ANISOTROPIC PLASTICITY AND FAILURE PREDICTION IN WOOD COMPOSI...<br />
elements (Foschi, 1974, Foschi <strong>and</strong> Longworth, 1975). Wood behavior <strong>in</strong> compression was <strong>in</strong>cluded <strong>in</strong> this model<br />
through a non-l<strong>in</strong>ear elastic foundation with the beam elements, result<strong>in</strong>g <strong>in</strong> non-l<strong>in</strong>ear load-displacement<br />
response curves for the head of the nail. Ultimate strength was predicted us<strong>in</strong>g the Weibull weakest l<strong>in</strong>k theory.<br />
Results from Foschi <strong>and</strong> Longworth (1975) currently form the basis of the timber rivet design formulae <strong>in</strong> the<br />
Canadian st<strong>and</strong>ard for Eng<strong>in</strong>eer<strong>in</strong>g Design <strong>in</strong> Wood (O86.1, 1995).<br />
The two-dimensional studies discussed <strong>in</strong> section 2.1 showed that a non-l<strong>in</strong>ear model for compression parallel-togra<strong>in</strong><br />
improved stress <strong>prediction</strong>s. The two-dimensional model is, however, limited to the study of relatively th<strong>in</strong><br />
members. This restricts the analysis to only simple cases. S<strong>in</strong>ce the <strong>prediction</strong> of <strong>failure</strong> is dependent on accurate<br />
<strong>prediction</strong>s of stress throughout the entire <strong>wood</strong> member, particularly <strong>in</strong> locations where stress concentrations<br />
exist, <strong>and</strong> <strong>in</strong> <strong>in</strong>stances where member aspect ratio cause deformations to vary throughout the member thickness,<br />
the two-dimensional model will not suffice (Patton-Mallory et al., 1997).<br />
Patton-Mallory et al. (1997) developed a three-dimensional f<strong>in</strong>ite element model of a s<strong>in</strong>gle-bolt connection, <strong>in</strong><br />
solid sawn Douglas fir, similar to the one shown <strong>in</strong> Figure 9. Solid brick elements were used for the steel bolt <strong>and</strong><br />
the <strong>wood</strong>. A contact <strong>in</strong>terface was placed between the bolt <strong>and</strong> <strong>wood</strong> <strong>and</strong> assumed to be frictionless. One-quarter<br />
of the geometry was modeled due to symmetry. The geometry of the model could be modified for changes <strong>in</strong> end<br />
distance, edge distance, member thickness, bolt diameter, hole clearance, <strong>and</strong> support location. No side<br />
members were <strong>in</strong>cluded <strong>in</strong> the model to isolate the behavior of the connector. Tri-l<strong>in</strong>ear elastic stress-stra<strong>in</strong><br />
behavior was assumed for the <strong>wood</strong> <strong>in</strong> compression parallel-to-gra<strong>in</strong> <strong>and</strong> <strong>in</strong> shear, with an elastic-perfectly plastic<br />
steel p<strong>in</strong>. L<strong>in</strong>ear elastic properties were assumed for all other stresses, <strong>in</strong>clud<strong>in</strong>g all tensile normal stresses. As<br />
mentioned <strong>in</strong> section 2.1, a number of drawbacks exist with this model. However, this was the first numerical<br />
model to <strong>in</strong>dicate likely <strong>failure</strong> modes <strong>in</strong> three-dimensions for <strong>wood</strong>. Patton-Mallory et al. (1997) recommended<br />
that improvements to the material model (non-l<strong>in</strong>ear constitutive behavior <strong>and</strong> <strong>failure</strong> <strong>prediction</strong>) will result <strong>in</strong><br />
improved stress calculations lead<strong>in</strong>g to better calculations of ultimate connection load.<br />
The geometry shown <strong>in</strong> Figure 9 was used for the current study. SOLID45 elements were used for the bolt <strong>and</strong><br />
<strong>wood</strong>. The contact <strong>in</strong>terface was modeled with CONTAC49 elements. Friction was <strong>in</strong>cluded on the <strong>in</strong>terface.<br />
Bil<strong>in</strong>ear k<strong>in</strong>ematic harden<strong>in</strong>g was assumed for bolt yield<strong>in</strong>g behavior, whereas the <strong>anisotropic</strong> <strong>plasticity</strong> option was<br />
used for the <strong>wood</strong> member. Load-displacement curves of the connection were found from experiments on LSL<br />
where the displacement of the end of the bolt relative to a po<strong>in</strong>t on the <strong>wood</strong> member 12.7 cm (5 <strong>in</strong>ches) from the<br />
center of the bolt hole was measured. This displacement can be compared directly to the displacement output<br />
from the model. The bolt elements extend out from the face of the <strong>wood</strong> member by 1.3 cm (0.5 <strong>in</strong>ches) to<br />
simulate experimental conditions where the po<strong>in</strong>ts of load application were on the steel bolt 1.3 cm (0.5 <strong>in</strong>ches)<br />
from each face of the member. Due to symmetry, only one quarter of the actual <strong>wood</strong> member <strong>and</strong> bolt were<br />
modeled. The <strong>wood</strong> member was def<strong>in</strong>ed to have an oversized hole, with specified end distance, edge distance<br />
<strong>and</strong> thickness. The highly stressed region <strong>in</strong> the <strong>wood</strong> member extends from the po<strong>in</strong>t where the dowel contacts<br />
the <strong>wood</strong> member to the free end of the member <strong>and</strong> through the member thickness. A higher mesh density of<br />
quadrilateral bricks was used <strong>in</strong> this region.<br />
Figure 9. SINGLE-BOLT CONNECTION MODEL GEOMETRY<br />
WOOD PROPERTIES SET PARALLEL-TO Y-DIRECTION, X-DIRECTION, OR 45° BETWEEN,<br />
FOR LOADING PARALLEL-TO, PERPENDICULAR-TO AND AT 45°-TO-GRAIN, RESPECTIVELY<br />
file://C:\Documents%20<strong>and</strong>%20Sett<strong>in</strong>gs\beh\Local%20Sett<strong>in</strong>gs\Temp\~hhC936.htm<br />
Page 17 of 22<br />
7/9/2002
ANISOTROPIC PLASTICITY AND FAILURE PREDICTION IN WOOD COMPOSI...<br />
The unbolted end of the member was restricted from displacements <strong>in</strong> the Y-direction by apply<strong>in</strong>g a zerodisplacement<br />
boundary along the plane normal to the Y-direction as shown <strong>in</strong> Figure 9. The two planes of<br />
symmetry <strong>in</strong> the <strong>wood</strong> <strong>and</strong> dowel were modeled with zero-displacement boundary conditions <strong>in</strong> the planes normal<br />
to the X- <strong>and</strong> Z-directions. Displacements were applied to the end of the bolt to simulate the experimental<br />
displacement-controlled conditions. These displacements were fixed <strong>in</strong> the Y-direction towards the bolted end of<br />
<strong>wood</strong> member.<br />
One model was used for each connection geometry <strong>and</strong> set of material properties. The solution was non-l<strong>in</strong>ear<br />
due to material non-l<strong>in</strong>earity <strong>and</strong> the iterations required to enforce the contact compatibility. Displacements to the<br />
end of the dowel were imposed <strong>in</strong> small steps to assist <strong>in</strong> convergence. Data was saved for each step.<br />
Convergence was not typically possible beyond total displacement of roughly 2.5 mm (0.1 <strong>in</strong>ch) even though<br />
experimental displacements were much larger. Enough <strong>in</strong>formation about the performance of the connection<br />
could be determ<strong>in</strong>ed, however, as will be shown shortly.<br />
CASE II - Results<br />
Load-displacement curves from the experiments <strong>and</strong> from <strong>ANSYS</strong> are shown <strong>in</strong> Figure 10 for load<strong>in</strong>g parallel-to<br />
<strong>and</strong> perpendicular-to-gra<strong>in</strong>, respectively. Specimens with 9.5 mm (3/8 <strong>in</strong>ch) <strong>and</strong> 19 mm (3/4 <strong>in</strong>ch) diameter, d,<br />
bolts are discussed here. Two end distances, 2d <strong>and</strong> 4d were chosen to force a change <strong>in</strong> the mode of <strong>failure</strong>.<br />
Values of maximum load, maximum displacement along with the mode <strong>failure</strong> are listed <strong>in</strong> Tables 7, 8 <strong>and</strong> 9, each<br />
correspond<strong>in</strong>g to the direction of load<strong>in</strong>g.<br />
Figure 10. LOAD-DISPLACEMENT CURVES FOR SINGLE-BOLT CONNECTIONS LOADED<br />
(A) PARALLEL-TO-GRAIN, AND (B) PERPENDICULAR-TO-GRAIN. DARK LINE IS RESULT<br />
FROM <strong>ANSYS</strong><br />
file://C:\Documents%20<strong>and</strong>%20Sett<strong>in</strong>gs\beh\Local%20Sett<strong>in</strong>gs\Temp\~hhC936.htm<br />
Page 18 of 22<br />
7/9/2002
ANISOTROPIC PLASTICITY AND FAILURE PREDICTION IN WOOD COMPOSI...<br />
In general, load-displacement curves were well matched. L<strong>in</strong>ear <strong>and</strong> non-l<strong>in</strong>ear load-displacement behavior were<br />
predicted correspond<strong>in</strong>g to the experimental results. Ultimate strengths, listed <strong>in</strong> Tables 7 to 9, were always<br />
predicted conservatively to be with<strong>in</strong> 50 to 84% of the experimental averages for all load<strong>in</strong>g directions. Ultimate<br />
displacements were found to be with<strong>in</strong> 17 to 88% of the experimental averages, however, displacement data<br />
along with the load-displacement curves provide <strong>in</strong>formation about the overall expected behavior of a particular<br />
connection. Mode of <strong>failure</strong> <strong>prediction</strong>s were well matched with experimental observations.<br />
Table 7. Failure data for s<strong>in</strong>gle-bolt connections loaded parallel-to-gra<strong>in</strong><br />
Bolt<br />
size<br />
End<br />
dist.<br />
Max.<br />
load<br />
(lbs.)<br />
Experiments (a) Model (b) Model/experiments<br />
Max.<br />
disp.<br />
(<strong>in</strong>.)<br />
Failure<br />
mode<br />
Max.<br />
load<br />
(lbs.)<br />
Max.<br />
disp.<br />
(<strong>in</strong>.)<br />
Failure<br />
mode<br />
file://C:\Documents%20<strong>and</strong>%20Sett<strong>in</strong>gs\beh\Local%20Sett<strong>in</strong>gs\Temp\~hhC936.htm<br />
Load Disp.<br />
Page 19 of 22<br />
7/9/2002
ANISOTROPIC PLASTICITY AND FAILURE PREDICTION IN WOOD COMPOSI...<br />
3/8" 2d 1793 0.11<br />
tension<br />
(a) Ductile behavior with no <strong>in</strong>dication of brittle <strong>failure</strong> is <strong>in</strong>dicated by the greater-than symbol<br />
(b) Cases where model convergence was not possible beyond an applied displacement are<br />
<strong>in</strong>dicated with the greater-than-symbol<br />
Table 8. Failure data for s<strong>in</strong>gle-bolt connections loaded perpendicular-to-gra<strong>in</strong><br />
Table 9. Failure data for s<strong>in</strong>gle-bolt connections loaded 45 -to-gra<strong>in</strong><br />
X<br />
>1327 >0.10 ductile - -<br />
3/8" 4d >2329 >0.39 ductile >1374 >0.12 ductile - -<br />
3/4" 2d 4447 0.05<br />
tension<br />
X<br />
3723 0.04<br />
3/4" 4d >7272 >0.11 ductile 5884 0.06<br />
Bolt<br />
size<br />
End<br />
dist.<br />
Max.<br />
load<br />
(lbs.)<br />
Experiments (a)<br />
Max.<br />
disp.<br />
(<strong>in</strong>.)<br />
3/8" 2d 1422 0.08<br />
3/8" 4d 1571 0.13<br />
3/4" 2d 3489 0.09<br />
3/4" 4d 3409 0.08<br />
Bolt<br />
size<br />
End<br />
dist.<br />
Max.<br />
load<br />
(lbs.)<br />
Failure<br />
mode<br />
tension<br />
X<br />
tension<br />
X<br />
tension<br />
X<br />
tension<br />
X<br />
Experiments (a)<br />
Max.<br />
disp.<br />
(<strong>in</strong>.)<br />
3/8" 2d 1925 0.13<br />
3/8" 4d >2402 >0.39<br />
Failure<br />
mode<br />
tension<br />
X<br />
tension<br />
Max.<br />
load<br />
(lbs.)<br />
tension<br />
X,Z<br />
tension<br />
Z<br />
0.84 0.8<br />
0.81 0.55<br />
Model (b) Model/experiments<br />
Max.<br />
disp.<br />
(<strong>in</strong>.)<br />
1102 0.07<br />
1121 0.07<br />
1685 0.04<br />
1729 0.04<br />
Max.<br />
load<br />
(lbs.)<br />
Failure<br />
mode<br />
tension<br />
X<br />
tension<br />
X<br />
tension<br />
X<br />
tension<br />
X<br />
Load Disp.<br />
0.77 0.88<br />
0.71 0.54<br />
0.48 0.44<br />
0.51 0.50<br />
Model (b) Model/experiments<br />
Max.<br />
disp.<br />
(<strong>in</strong>.)<br />
Failure<br />
mode<br />
Load Disp.<br />
>1168 >0.05 ductile - -<br />
>1244 >0.06 ductile - -<br />
file://C:\Documents%20<strong>and</strong>%20Sett<strong>in</strong>gs\beh\Local%20Sett<strong>in</strong>gs\Temp\~hhC936.htm<br />
Page 20 of 22<br />
7/9/2002
ANISOTROPIC PLASTICITY AND FAILURE PREDICTION IN WOOD COMPOSI...<br />
3/4" 2d 4067 0.07<br />
3/4" 4d 6145 0.24<br />
X<br />
tension<br />
X<br />
tension<br />
X<br />
2055 0.03<br />
3333 0.04<br />
(a) Ductile behavior with no <strong>in</strong>dication of brittle <strong>failure</strong> is <strong>in</strong>dicated by the greater-than symbol<br />
(b) Cases where model convergence was not possible beyond an applied displacement are<br />
<strong>in</strong>dicated with the greater-than-symbol<br />
SUMMARY<br />
F<strong>in</strong>ite element analysis provides a useful method for model<strong>in</strong>g the behavior of <strong>wood</strong> composites <strong>and</strong> bolted<br />
connections <strong>in</strong> the composites. Material non-l<strong>in</strong>earities, such as those which are present when <strong>wood</strong> is crushed,<br />
can be <strong>in</strong>cluded. Failure <strong>prediction</strong> can also be made based on the predicted stress distribution from the material<br />
model.<br />
It was shown that the shear strength of <strong>wood</strong> <strong>in</strong> the primary shear planes could be determ<strong>in</strong>ed from the shear<br />
block f<strong>in</strong>ite element model. The connection model shows promise for future studies on end distance, edge<br />
distance <strong>and</strong> other geometric effects. The direction of load<strong>in</strong>g relative to the material was easily modeled. Work is<br />
underway to extend this model to multiple-bolt connections.<br />
Sensitivity analysis of connection behavior to material properties will help to determ<strong>in</strong>e which material variables<br />
are most important <strong>in</strong> the production of <strong>wood</strong> composites. This model also provides opportunities for prototyp<strong>in</strong>g<br />
new <strong>wood</strong> composites made from multiple-layers with different orientations. In this way, certa<strong>in</strong> <strong>failure</strong> modes <strong>in</strong><br />
connections can be prevented or changed.<br />
ACKNOWLEDGEMENTS<br />
F<strong>in</strong>ancial support for this project has been provided by the Science Council of British Columbia, Trus Joist<br />
MacMillan <strong>and</strong> Forest Renewal British Columbia.<br />
REFERENCES<br />
tension<br />
American Society for Test<strong>in</strong>g <strong>and</strong> Materials (ASTM), 1991, "St<strong>and</strong>ard Methods of Test<strong>in</strong>g Small Clear Specimens<br />
of Timber" ASTM D143-83. Pennsylvania.<br />
<strong>ANSYS</strong>, 1992, <strong>ANSYS</strong> User’s Manual for Revision 5.0, Volume IV Theory, Swanson Analysis Systems Inc.,<br />
Houston, Pennsylvania.<br />
Barrett, J.D., 1974, "Effect of size on tension perpendicular-to-gra<strong>in</strong> strength of Douglas Fir" Wood <strong>and</strong> Fiber, Vol.<br />
6, No. 2, pp. 126-143.<br />
Bradtmueller, J.P., Hunt, M.O., Fridley, K.J., McCabe, G.P., 1997, "Mechanical properties of OSB via the fivepo<strong>in</strong>t<br />
bend<strong>in</strong>g test" Forest Products Journal, Vol. 47, No. 9, pp. 70-77.<br />
Coker, E.G., Coleman, G.P., 1935, "Photo-elastic <strong>in</strong>vestigation of shear tests of timber" Selected Eng<strong>in</strong>eer<strong>in</strong>g<br />
Papers No. 174, The Institution of Civil Eng<strong>in</strong>eers, London, Engl<strong>and</strong>.<br />
X<br />
tension<br />
file://C:\Documents%20<strong>and</strong>%20Sett<strong>in</strong>gs\beh\Local%20Sett<strong>in</strong>gs\Temp\~hhC936.htm<br />
X<br />
0.51 0.43<br />
0.54 0.17<br />
Page 21 of 22<br />
7/9/2002
ANISOTROPIC PLASTICITY AND FAILURE PREDICTION IN WOOD COMPOSI...<br />
Cramer, S.M., Goodman, J.R., Bodig, J., Smith, F.W., 1984, "Failure model<strong>in</strong>g of <strong>wood</strong> structural members"<br />
Structural Res. No. 51, Civil Eng<strong>in</strong>eer<strong>in</strong>g Department, Colorado State University, Fort Coll<strong>in</strong>s, Colorado.<br />
Fonselius, M., Riipola, K., 1992, "Determ<strong>in</strong>ation of fracture toughness for <strong>wood</strong>" Journal of Structural Eng<strong>in</strong>eer<strong>in</strong>g,<br />
ASCE, Vol. 118, No. 7, pp. 1727-1740.<br />
Foschi, R.O., 1974 "Load-Slip Characteristics of Nails" Wood Science, Vol. 7, No. 1, pp. 69-76.<br />
1976, "Longitud<strong>in</strong>al shear strength of Douglas-fir" Canadian Journal of Civil Eng<strong>in</strong>eer<strong>in</strong>g, Vol. 3, No. 2, pp. 198-<br />
208.<br />
Foschi, R.O., Longworth, J., 1975, "Analysis <strong>and</strong> design of griplam nailed connections" Journal of the Structural<br />
Division, ASCE, Vol. 101, ST12, December, pp. 2537-2555.<br />
Hill, R., 1947, "A theory of the yield<strong>in</strong>g <strong>and</strong> plastic flow of <strong>anisotropic</strong> metals" Proceed<strong>in</strong>gs of the Royal Society<br />
Series A, Vol. 193, pp. 281-297.<br />
Hoover, W.L., Hunt, M.O., Lattanzi, R.C., Bateman, J.H., Youngquist, J.A., 1992, "Modell<strong>in</strong>g mechanical<br />
properties of s<strong>in</strong>gle-layer, aligned, mixed-hard<strong>wood</strong> str<strong>and</strong> panels" Forest Products Journal, Vol. 42, No. 5, pp.<br />
12-18.<br />
Hunt, M.O., Hoover, W.L., Fergus, D.A., 1985, "Thick aspen structural flakeboard" Forest Products Journal, Vol.<br />
35, No. 4, pp. 33-39.<br />
Hyer, M.W., Klang, E.C., Cooper, D.E., 1987, "The effects of p<strong>in</strong> elasticity, clearance <strong>and</strong> friction on the stresses<br />
<strong>in</strong> a p<strong>in</strong>-loaded orthotropic plate" Journal of Composite Materials, Vol. 21, pp. 190-206.<br />
Liu, J.Y., 1984, "Evaluation of the tensor polynomial strength theory for <strong>wood</strong>" Journal of Composite Materials,<br />
Vol. 18, pp. 216-226.<br />
Moses, D.M., Prion, H.G.L., 1999, "Bolted connections <strong>in</strong> structural composite lumber: <strong>anisotropic</strong> <strong>plasticity</strong><br />
model" Proceed<strong>in</strong>gs of the Pacific Timber Eng<strong>in</strong>eer<strong>in</strong>g Conference, Rotorua, New Zeal<strong>and</strong>, Vol. 2, pp. 92-99.<br />
O86.1, 1995, Eng<strong>in</strong>eer<strong>in</strong>g Design <strong>in</strong> Wood (Limit States Design), Canadian St<strong>and</strong>ards Association, Rexdale,<br />
Ontario, pp. 191.<br />
Patton-Mallory, M., Cramer, S.M., Smith, F.W., Pellicane, P.J., 1997, "Nonl<strong>in</strong>ear material models for analysis of<br />
bolted <strong>wood</strong> connections" Journal of Structural Eng<strong>in</strong>eer<strong>in</strong>g, Vol. 123, No. 8, pp. 1063-1070.<br />
Rahman, M.U., Chiang, Y.J., Rowl<strong>and</strong>s, R.E., 1991, "Stress <strong>and</strong> <strong>failure</strong> analysis of double-bolted jo<strong>in</strong>ts <strong>in</strong> Douglas<br />
Fir <strong>and</strong> Sitka Spruce" Wood <strong>and</strong> Fiber Science, Vol. 23, No. 4, pp. 567-589.<br />
Shih, C.F., Lee, D., 1978, "Further developments <strong>in</strong> <strong>anisotropic</strong> <strong>plasticity</strong>" Transactions of the ASME, Journal of<br />
Eng<strong>in</strong>eer<strong>in</strong>g Materials <strong>and</strong> Technology, July 1978, Vol. 100, pp. 294-302.<br />
Tsai, S.W., Wu, E.M., 1971, "A general theory of strength for <strong>anisotropic</strong> materials" Journal of Composite<br />
Materials, Vol. 5, pp. 58-80.<br />
Valliappan, S., Boonlaulohr, P., Lee, I.K., 1976, "Non-l<strong>in</strong>ear analysis for <strong>anisotropic</strong> materials" International<br />
Journal for Numerical Methods <strong>in</strong> Eng<strong>in</strong>eer<strong>in</strong>g, Vol. 10, pp. 597-606.<br />
Page 22 of 22<br />
Vaziri, R., Olson, M.D., Anderson, D.L., 1991, "A <strong>plasticity</strong>-based constitutive model for fibre-re<strong>in</strong>forced composite<br />
lam<strong>in</strong>ates" Journal of Composite Materials, Vol. 25, May, pp. 512-535.<br />
Wilk<strong>in</strong>son, T.L., Rowl<strong>and</strong>s, R.E., Cook, R.D., 1981, "An <strong>in</strong>cremental f<strong>in</strong>ite-element determ<strong>in</strong>ation of stresses<br />
around loaded holes <strong>in</strong> <strong>wood</strong> plates" Computers & Structures, Vol. 14, No. 1, pp. 123-128.<br />
file://C:\Documents%20<strong>and</strong>%20Sett<strong>in</strong>gs\beh\Local%20Sett<strong>in</strong>gs\Temp\~hhC936.htm<br />
7/9/2002