Debt Analysts' Views of Debt-Equity Conflicts of Interest
Debt Analysts' Views of Debt-Equity Conflicts of Interest
Debt Analysts' Views of Debt-Equity Conflicts of Interest

Create successful ePaper yourself
Turn your PDF publications into a flip-book with our unique Google optimized e-Paper software.
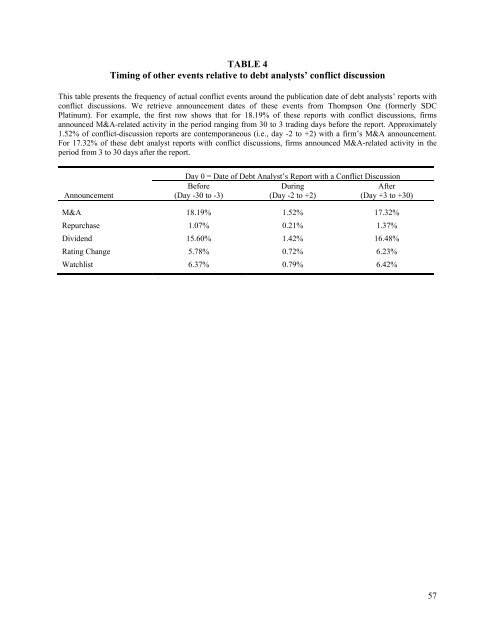
TABLE 4<br />
Timing <strong>of</strong> other events relative to debt analysts’ conflict discussion<br />
This table presents the frequency <strong>of</strong> actual conflict events around the publication date <strong>of</strong> debt analysts’ reports with<br />
conflict discussions. We retrieve announcement dates <strong>of</strong> these events from Thompson One (formerly SDC<br />
Platinum). For example, the first row shows that for 18.19% <strong>of</strong> these reports with conflict discussions, firms<br />
announced M&A-related activity in the period ranging from 30 to 3 trading days before the report. Approximately<br />
1.52% <strong>of</strong> conflict-discussion reports are contemporaneous (i.e., day -2 to +2) with a firm’s M&A announcement.<br />
For 17.32% <strong>of</strong> these debt analyst reports with conflict discussions, firms announced M&A-related activity in the<br />
period from 3 to 30 days after the report.<br />
Day 0 = Date <strong>of</strong> <strong>Debt</strong> Analyst’s Report with a Conflict Discussion<br />
Before During After<br />
Announcement (Day -30 to -3) (Day -2 to +2) (Day +3 to +30)<br />
M&A 18.19% 1.52% 17.32%<br />
Repurchase 1.07% 0.21% 1.37%<br />
Dividend 15.60% 1.42% 16.48%<br />
Rating Change 5.78% 0.72% 6.23%<br />
Watchlist 6.37% 0.79% 6.42%<br />
57