Debt Analysts' Views of Debt-Equity Conflicts of Interest
Debt Analysts' Views of Debt-Equity Conflicts of Interest
Debt Analysts' Views of Debt-Equity Conflicts of Interest

You also want an ePaper? Increase the reach of your titles
YUMPU automatically turns print PDFs into web optimized ePapers that Google loves.
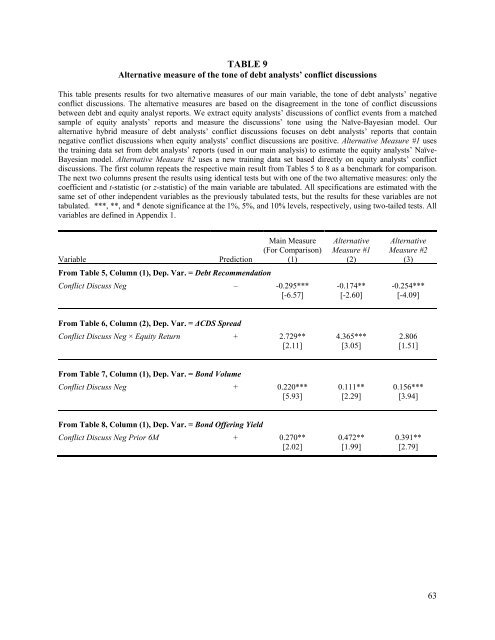
TABLE 9<br />
Alternative measure <strong>of</strong> the tone <strong>of</strong> debt analysts’ conflict discussions<br />
This table presents results for two alternative measures <strong>of</strong> our main variable, the tone <strong>of</strong> debt analysts’ negative<br />
conflict discussions. The alternative measures are based on the disagreement in the tone <strong>of</strong> conflict discussions<br />
between debt and equity analyst reports. We extract equity analysts’ discussions <strong>of</strong> conflict events from a matched<br />
sample <strong>of</strong> equity analysts’ reports and measure the discussions’ tone using the Naïve-Bayesian model. Our<br />
alternative hybrid measure <strong>of</strong> debt analysts’ conflict discussions focuses on debt analysts’ reports that contain<br />
negative conflict discussions when equity analysts’ conflict discussions are positive. Alternative Measure #1 uses<br />
the training data set from debt analysts’ reports (used in our main analysis) to estimate the equity analysts’ Naïve-<br />
Bayesian model. Alternative Measure #2 uses a new training data set based directly on equity analysts’ conflict<br />
discussions. The first column repeats the respective main result from Tables 5 to 8 as a benchmark for comparison.<br />
The next two columns present the results using identical tests but with one <strong>of</strong> the two alternative measures: only the<br />
coefficient and t-statistic (or z-statistic) <strong>of</strong> the main variable are tabulated. All specifications are estimated with the<br />
same set <strong>of</strong> other independent variables as the previously tabulated tests, but the results for these variables are not<br />
tabulated. ***, **, and * denote significance at the 1%, 5%, and 10% levels, respectively, using two-tailed tests. All<br />
variables are defined in Appendix 1.<br />
Main Measure Alternative Alternative<br />
(For Comparison) Measure #1 Measure #2<br />
Variable Prediction (1) (2) (3)<br />
From Table 5, Column (1), Dep. Var. = <strong>Debt</strong> Recommendation<br />
Conflict Discuss Neg – -0.295*** -0.174** -0.254***<br />
[-6.57] [-2.60] [-4.09]<br />
From Table 6, Column (2), Dep. Var. = ΔCDS Spread<br />
Conflict Discuss Neg × <strong>Equity</strong> Return + 2.729** 4.365*** 2.806<br />
[2.11] [3.05] [1.51]<br />
From Table 7, Column (1), Dep. Var. = Bond Volume<br />
Conflict Discuss Neg + 0.220*** 0.111** 0.156***<br />
[5.93] [2.29] [3.94]<br />
From Table 8, Column (1), Dep. Var. = Bond Offering Yield<br />
Conflict Discuss Neg Prior 6M + 0.270** 0.472** 0.391**<br />
[2.02] [1.99] [2.79]<br />
63