Debt Analysts' Views of Debt-Equity Conflicts of Interest
Debt Analysts' Views of Debt-Equity Conflicts of Interest
Debt Analysts' Views of Debt-Equity Conflicts of Interest

You also want an ePaper? Increase the reach of your titles
YUMPU automatically turns print PDFs into web optimized ePapers that Google loves.
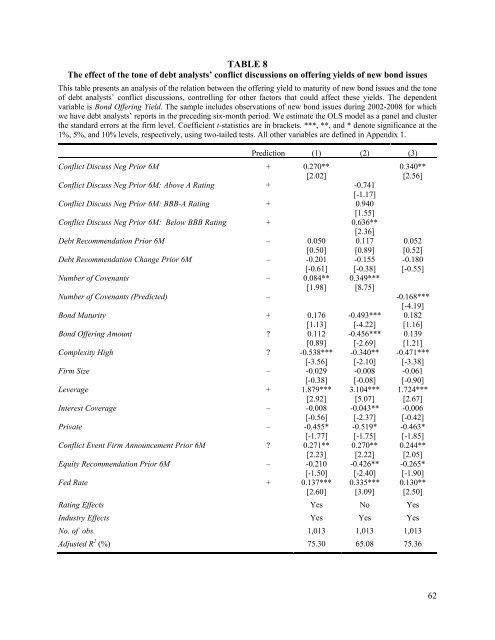
TABLE 8<br />
The effect <strong>of</strong> the tone <strong>of</strong> debt analysts’ conflict discussions on <strong>of</strong>fering yields <strong>of</strong> new bond issues<br />
This table presents an analysis <strong>of</strong> the relation between the <strong>of</strong>fering yield to maturity <strong>of</strong> new bond issues and the tone<br />
<strong>of</strong> debt analysts’ conflict discussions, controlling for other factors that could affect these yields. The dependent<br />
variable is Bond Offering Yield. The sample includes observations <strong>of</strong> new bond issues during 2002-2008 for which<br />
we have debt analysts’ reports in the preceding six-month period. We estimate the OLS model as a panel and cluster<br />
the standard errors at the firm level. Coefficient t-statistics are in brackets. ***, **, and * denote significance at the<br />
1%, 5%, and 10% levels, respectively, using two-tailed tests. All other variables are defined in Appendix 1.<br />
Prediction (1) (2) (3)<br />
Conflict Discuss Neg Prior 6M + 0.270** 0.340**<br />
[2.02] [2.56]<br />
Conflict Discuss Neg Prior 6M: Above A Rating + -0.741<br />
[-1.17]<br />
Conflict Discuss Neg Prior 6M: BBB-A Rating + 0.940<br />
[1.55]<br />
Conflict Discuss Neg Prior 6M: Below BBB Rating + 0.636**<br />
[2.36]<br />
<strong>Debt</strong> Recommendation Prior 6M – 0.050 0.117 0.052<br />
[0.50] [0.89] [0.52]<br />
<strong>Debt</strong> Recommendation Change Prior 6M – -0.201 -0.155 -0.180<br />
[-0.61] [-0.38] [-0.55]<br />
Number <strong>of</strong> Covenants – 0.084** 0.349***<br />
[1.98] [8.75]<br />
Number <strong>of</strong> Covenants (Predicted) – -0.168***<br />
[-4.19]<br />
Bond Maturity + 0.176 -0.493*** 0.182<br />
[1.13] [-4.22] [1.16]<br />
Bond Offering Amount ? 0.112 -0.456*** 0.139<br />
[0.89] [-2.69] [1.21]<br />
Complexity High ? -0.538*** -0.340** -0.471***<br />
[-3.56] [-2.10] [-3.38]<br />
Firm Size – -0.029 -0.008 -0.061<br />
[-0.38] [-0.08] [-0.90]<br />
Leverage + 1.879*** 3.104*** 1.724***<br />
[2.92] [5.07] [2.67]<br />
<strong>Interest</strong> Coverage – -0.008 -0.043** -0.006<br />
[-0.56] [-2.37] [-0.42]<br />
Private – -0.455* -0.519* -0.463*<br />
[-1.77] [-1.75] [-1.85]<br />
Conflict Event Firm Announcement Prior 6M ? 0.271** 0.270** 0.244**<br />
[2.23] [2.22] [2.05]<br />
<strong>Equity</strong> Recommendation Prior 6M – -0.210 -0.426** -0.265*<br />
[-1.50] [-2.40] [-1.90]<br />
Fed Rate + 0.137*** 0.335*** 0.130**<br />
[2.60] [3.09] [2.50]<br />
Rating Effects Yes No Yes<br />
Industry Effects Yes Yes Yes<br />
No. <strong>of</strong> obs. 1,013 1,013 1,013<br />
Adjusted R 2 (%) 75.30 65.08 75.36<br />
62