19.1 Payoff Tables and Decision Trees
19.1 Payoff Tables and Decision Trees
19.1 Payoff Tables and Decision Trees

Create successful ePaper yourself
Turn your PDF publications into a flip-book with our unique Google optimized e-Paper software.
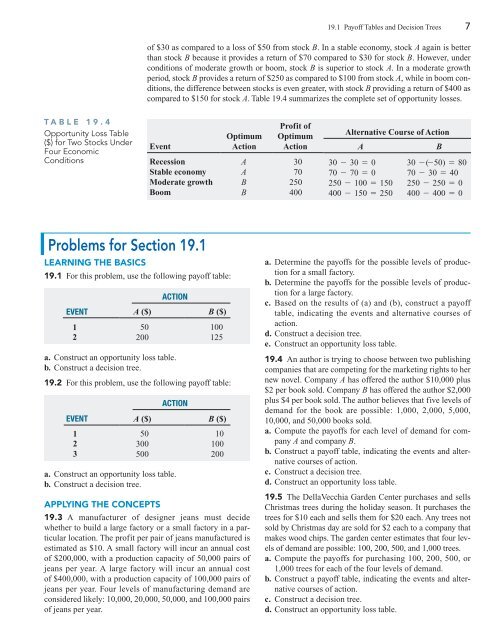
TABLE 19.4<br />
Opportunity Loss Table<br />
($) for Two Stocks Under<br />
Four Economic<br />
Conditions<br />
Problems for Section <strong>19.1</strong><br />
LEARNING THE BASICS<br />
<strong>19.1</strong> For this problem, use the following payoff table:<br />
a. Construct an opportunity loss table.<br />
b. Construct a decision tree.<br />
19.2 For this problem, use the following payoff table:<br />
a. Construct an opportunity loss table.<br />
b. Construct a decision tree.<br />
APPLYING THE CONCEPTS<br />
ACTION<br />
EVENT A ($) B ($)<br />
1 50 100<br />
2 200 125<br />
ACTION<br />
EVENT A ($) B ($)<br />
1 50 10<br />
2 300 100<br />
3 500 200<br />
19.3 A manufacturer of designer jeans must decide<br />
whether to build a large factory or a small factory in a particular<br />
location. The profit per pair of jeans manufactured is<br />
estimated as $10. A small factory will incur an annual cost<br />
of $200,000, with a production capacity of 50,000 pairs of<br />
jeans per year. A large factory will incur an annual cost<br />
of $400,000, with a production capacity of 100,000 pairs of<br />
jeans per year. Four levels of manufacturing dem<strong>and</strong> are<br />
considered likely: 10,000, 20,000, 50,000, <strong>and</strong> 100,000 pairs<br />
of jeans per year.<br />
<strong>19.1</strong> <strong>Payoff</strong> <strong>Tables</strong> <strong>and</strong> <strong>Decision</strong> <strong>Trees</strong> 7<br />
of $30 as compared to a loss of $50 from stock B. In a stable economy, stock A again is better<br />
than stock B because it provides a return of $70 compared to $30 for stock B. However, under<br />
conditions of moderate growth or boom, stock B is superior to stock A. In a moderate growth<br />
period, stock B provides a return of $250 as compared to $100 from stock A, while in boom conditions,<br />
the difference between stocks is even greater, with stock B providing a return of $400 as<br />
compared to $150 for stock A. Table 19.4 summarizes the complete set of opportunity losses.<br />
Event<br />
Optimum<br />
Action<br />
Profit of<br />
Optimum<br />
Action<br />
Alternative Course of Action<br />
A B<br />
Recession A 30 30 - 30 = 0 30 - (-50) = 80<br />
Stable economy A 70 70 - 70 = 0 70 - 30 = 40<br />
Moderate growth B 250 250 - 100 = 150 250 - 250 = 0<br />
Boom B 400 400 - 150 = 250 400 - 400 = 0<br />
a. Determine the payoffs for the possible levels of production<br />
for a small factory.<br />
b. Determine the payoffs for the possible levels of production<br />
for a large factory.<br />
c. Based on the results of (a) <strong>and</strong> (b), construct a payoff<br />
table, indicating the events <strong>and</strong> alternative courses of<br />
action.<br />
d. Construct a decision tree.<br />
e. Construct an opportunity loss table.<br />
19.4 An author is trying to choose between two publishing<br />
companies that are competing for the marketing rights to her<br />
new novel. Company A has offered the author $10,000 plus<br />
$2 per book sold. Company B has offered the author $2,000<br />
plus $4 per book sold. The author believes that five levels of<br />
dem<strong>and</strong> for the book are possible: 1,000, 2,000, 5,000,<br />
10,000, <strong>and</strong> 50,000 books sold.<br />
a. Compute the payoffs for each level of dem<strong>and</strong> for company<br />
A <strong>and</strong> company B.<br />
b. Construct a payoff table, indicating the events <strong>and</strong> alternative<br />
courses of action.<br />
c. Construct a decision tree.<br />
d. Construct an opportunity loss table.<br />
19.5 The DellaVecchia Garden Center purchases <strong>and</strong> sells<br />
Christmas trees during the holiday season. It purchases the<br />
trees for $10 each <strong>and</strong> sells them for $20 each. Any trees not<br />
sold by Christmas day are sold for $2 each to a company that<br />
makes wood chips. The garden center estimates that four levels<br />
of dem<strong>and</strong> are possible: 100, 200, 500, <strong>and</strong> 1,000 trees.<br />
a. Compute the payoffs for purchasing 100, 200, 500, or<br />
1,000 trees for each of the four levels of dem<strong>and</strong>.<br />
b. Construct a payoff table, indicating the events <strong>and</strong> alternative<br />
courses of action.<br />
c. Construct a decision tree.<br />
d. Construct an opportunity loss table.