computing lives - FTP Directory Listing
computing lives - FTP Directory Listing
computing lives - FTP Directory Listing

Create successful ePaper yourself
Turn your PDF publications into a flip-book with our unique Google optimized e-Paper software.
A<br />
Computer Previous Page | Contents | Zoom in | Zoom out | Front Cover | Search Issue | Next Page M S BE<br />
aG<br />
F<br />
60<br />
RESEARCH FEATURE<br />
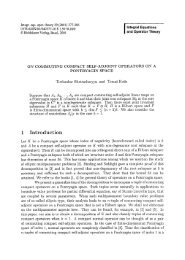
Figure 2. A GQM + Strategies model for ABC, a company that provides its customers with information services through the Web.<br />
GQM + Strategies enforces the explicit documentation of the relevant context factors and assumptions that are necessary for<br />
understanding and evaluating each goal. A Goal + Strategies element consists of a goal and an associated strategy (bottom of each<br />
goal box). Each element, in turn, is associated with a GQM graph (green rectangle to the right of the goal) representing questions and<br />
metrics as well as an interpretation model that evaluates if the goal was achieved.<br />
goals for various parts of the organization, such as software,<br />
hardware, and marketing. An organization might<br />
devise a separate set of strategies to deal with these lowerlevel<br />
goals. The number of goal and strategy levels depends<br />
on the organization’s internal structure.<br />
Assumptions and context information about the organization<br />
strongly influence the definition of goals and<br />
strategies. Measuring the effectiveness and the accomplishment<br />
of goals and the effectiveness of strategies at<br />
all levels is critical for business success. And making goals<br />
connected and transparent at all levels helps in communicating<br />
and achieving them. What most organizations need<br />
is support for these concepts.<br />
The components in Figure 1 provide this support by allowing<br />
multiple goal levels and multiple strategies for each<br />
goal (a GQM + Strategies element), as well as a measurement<br />
plan (GQM graph). The GQM + Strategies element provides<br />
the basic components for deriving the goals and strategies<br />
as influenced by the context; the basic known facts about<br />
the market, the organization, the product, and so on; and<br />
the assumptions—factors that are assumed or guessed<br />
but not known for sure. A key element is making the context<br />
and assumptions explicit so that they can be verified.<br />
The relevant context and assumptions aid in defining the<br />
rationale for choosing specific goals and strategies. A set<br />
COMPUTER<br />
Business level<br />
Software level<br />
Project level<br />
GQM + Strategies elements<br />
Goal 1: Increase profit<br />
from software service usage<br />
Strategy 1: Deliver<br />
added functionality<br />
Goal 2: Deliver 5% new<br />
functionality every 6 months<br />
within 10% of budget<br />
Strategy 2: Use MoSCoW<br />
and Cocomo<br />
Goal 3: Apply MoSCoW<br />
and Cocomo effectively<br />
Strategy 3: Conduct<br />
training, determine tools,<br />
perform pilot study<br />
GQM goals<br />
G1: Evaluate<br />
trend in profit<br />
G2: Evaluate<br />
functional<br />
growth of each<br />
release<br />
G3: Evaluate<br />
effectiveness<br />
of MoSCow<br />
and Cocomo<br />
Questions Metrics Interpretation model<br />
Q1: What is<br />
the current<br />
profit?<br />
Q2: What is<br />
the profit for<br />
year 2 and<br />
year 3?<br />
Q3: How<br />
many M<br />
requirements<br />
in each release?<br />
Q4: How<br />
long between<br />
releases?<br />
Q5: Cost<br />
estimation<br />
accuracy? BV: budget<br />
variance<br />
Q6: How<br />
extensive<br />
was the<br />
training?<br />
Q7: What is<br />
cost of<br />
training?<br />
P0: current<br />
annual<br />
profit<br />
PX: annual<br />
profit for<br />
year x<br />
MR: number<br />
of customerrequested<br />
requirements<br />
(M)<br />
implemented<br />
RD: release<br />
duration<br />
NT: number<br />
of trainees<br />
TC: hours<br />
spent in<br />
training<br />
If P2 0<br />
and<br />
P3 2<br />
and …<br />
then goal is<br />
satisfied<br />
of predefined goals and strategies can become part of an<br />
organization-specific experience base and allow different<br />
parts of the organization to select and adapt predefined<br />
goals and strategies.<br />
Associated with each GQM + Strategies element is a<br />
measurement plan that uses the GQM approach measurement<br />
and evaluation framework to specify how to<br />
evaluate the goal, what data to collect, and how to interpret<br />
that data. The nodes of each GQM graph consist of<br />
a measurement goal, which describes what knowledge<br />
needs to be gained from the measurement activity; a set<br />
of questions to be answered; the metrics and data items<br />
required to answer the questions; and an interpretation<br />
model that specifies how the data items are to be<br />
combined and what the criteria are for determining the<br />
goal’s success.<br />
The nodes are related semihierarchically. A goal can<br />
have several associated measurement goals, each of<br />
which is the basis for an entire GQM graph. However, different<br />
GQM structures are likely to use some of the same<br />
questions and metrics, and interpretation models might<br />
combine data from different GQM structures, thus optimizing<br />
metrics collection. The results of the lower-level<br />
interpretation models feed into the higher-level ones to<br />
provide feedback on lower-level goal achievement.<br />
A<br />
Computer Previous Page | Contents | Zoom in | Zoom out | Front Cover | Search Issue | Next Page M S BE<br />
aG<br />
F<br />
…<br />
…