

New Approaches to in silico Design of Epitope-Based Vaccines
New Approaches to in silico Design of Epitope-Based Vaccines
New Approaches to in silico Design of Epitope-Based Vaccines

Create successful ePaper yourself
Turn your PDF publications into a flip-book with our unique Google optimized e-Paper software.
4.3. MHC BINDING PREDICTION FOR ALL MHC-I ALLELES 41<br />
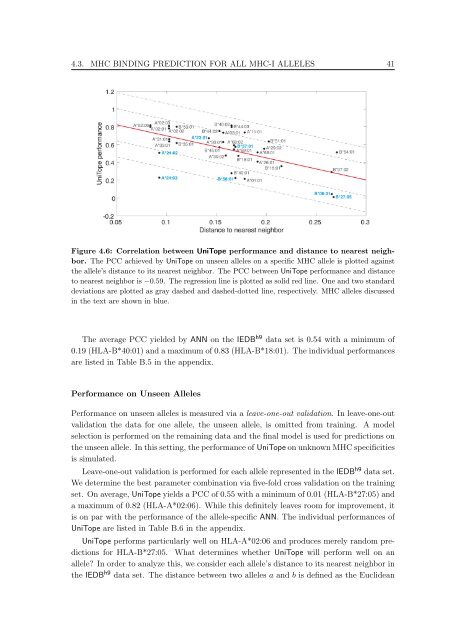
Figure 4.6: Correlation between UniTope performance and distance <strong>to</strong> nearest neighbor.<br />
The PCC achieved by UniTope on unseen alleles on a specific MHC allele is plotted aga<strong>in</strong>st<br />
the allele’s distance <strong>to</strong> its nearest neighbor. The PCC between UniTope performance and distance<br />
<strong>to</strong> nearest neighbor is −0.59. The regression l<strong>in</strong>e is plotted as solid red l<strong>in</strong>e. One and two standard<br />
deviations are plotted as gray dashed and dashed-dotted l<strong>in</strong>e, respectively. MHC alleles discussed<br />
<strong>in</strong> the text are shown <strong>in</strong> blue.<br />
The average PCC yielded by ANN on the IEDB h9 data set is 0.54 with a m<strong>in</strong>imum <strong>of</strong><br />
0.19 (HLA-B*40:01) and a maximum <strong>of</strong> 0.83 (HLA-B*18:01). The <strong>in</strong>dividual performances<br />
are listed <strong>in</strong> Table B.5 <strong>in</strong> the appendix.<br />
Performance on Unseen Alleles<br />
Performance on unseen alleles is measured via a leave-one-out validation. In leave-one-out<br />
validation the data for one allele, the unseen allele, is omitted from tra<strong>in</strong><strong>in</strong>g. A model<br />
selection is performed on the rema<strong>in</strong><strong>in</strong>g data and the f<strong>in</strong>al model is used for predictions on<br />
the unseen allele. In this sett<strong>in</strong>g, the performance <strong>of</strong> UniTope on unknown MHC specificities<br />
is simulated.<br />
Leave-one-out validation is performed for each allele represented <strong>in</strong> the IEDB h9 data set.<br />
We determ<strong>in</strong>e the best parameter comb<strong>in</strong>ation via five-fold cross validation on the tra<strong>in</strong><strong>in</strong>g<br />
set. On average, UniTope yields a PCC <strong>of</strong> 0.55 with a m<strong>in</strong>imum <strong>of</strong> 0.01 (HLA-B*27:05) and<br />
a maximum <strong>of</strong> 0.82 (HLA-A*02:06). While this def<strong>in</strong>itely leaves room for improvement, it<br />
is on par with the performance <strong>of</strong> the allele-specific ANN. The <strong>in</strong>dividual performances <strong>of</strong><br />
UniTope are listed <strong>in</strong> Table B.6 <strong>in</strong> the appendix.<br />
UniTope performs particularly well on HLA-A*02:06 and produces merely random predictions<br />
for HLA-B*27:05. What determ<strong>in</strong>es whether UniTope will perform well on an<br />
allele? In order <strong>to</strong> analyze this, we consider each allele’s distance <strong>to</strong> its nearest neighbor <strong>in</strong><br />
the IEDB h9 data set. The distance between two alleles a and b is def<strong>in</strong>ed as the Euclidean


