Exploration and Optimization of Tellurium‐Based Thermoelectrics
Exploration and Optimization of Tellurium‐Based Thermoelectrics
Exploration and Optimization of Tellurium‐Based Thermoelectrics

Create successful ePaper yourself
Turn your PDF publications into a flip-book with our unique Google optimized e-Paper software.
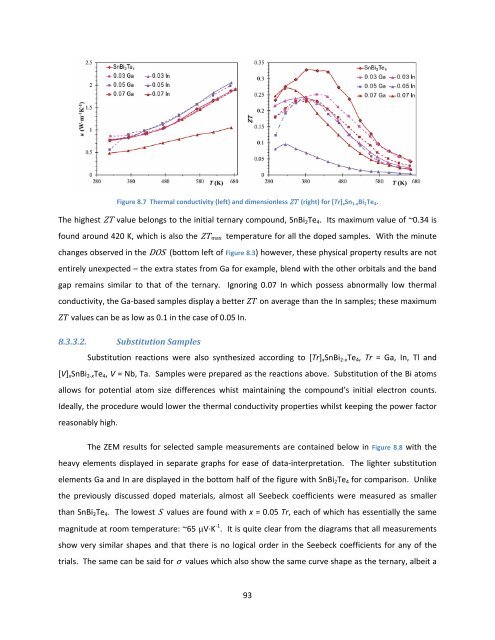
Figure 8.7 Thermal conductivity (left) <strong>and</strong> dimensionless ZT (right) for [Tr] xSn 1‐xBi 2Te 4.<br />
The highest ZT value belongs to the initial ternary compound, SnBi2Te4. Its maximum value <strong>of</strong> ~0.34 is<br />
found around 420 K, which is also the ZT max temperature for all the doped samples. With the minute<br />
changes observed in the DOS (bottom left <strong>of</strong> Figure 8.3) however, these physical property results are not<br />
entirely unexpected – the extra states from Ga for example, blend with the other orbitals <strong>and</strong> the b<strong>and</strong><br />
gap remains similar to that <strong>of</strong> the ternary. Ignoring 0.07 In which possess abnormally low thermal<br />
conductivity, the Ga‐based samples display a better on average than the In samples; these maximum<br />
values can be as low as 0.1 in the case <strong>of</strong> 0.05 In.<br />
8.3.3.2. Substitution Samples<br />
Substitution reactions were also synthesized according to [Tr]xSnBi2‐xTe4, Tr = Ga, In, Tl <strong>and</strong><br />
[V]xSnBi2‐xTe4, V = Nb, Ta. Samples were prepared as the reactions above. Substitution <strong>of</strong> the Bi atoms<br />
allows for potential atom size differences whist maintaining the compound’s initial electron counts.<br />
Ideally, the procedure would lower the thermal conductivity properties whilst keeping the power factor<br />
reasonably high.<br />
The ZEM results for selected sample measurements are contained below in Figure 8.8 with the<br />
heavy elements displayed in separate graphs for ease <strong>of</strong> data‐interpretation. The lighter substitution<br />
elements Ga <strong>and</strong> In are displayed in the bottom half <strong>of</strong> the figure with SnBi2Te4 for comparison. Unlike<br />
the previously discussed doped materials, almost all Seebeck coefficients were measured as smaller<br />
than SnBi2Te4. The lowest S values are found with x = 0.05 Tr, each <strong>of</strong> which has essentially the same<br />
magnitude at room temperature: ~65 V∙K ‐1 . It is quite clear from the diagrams that all measurements<br />
show very similar shapes <strong>and</strong> that there is no logical order in the Seebeck coefficients for any <strong>of</strong> the<br />
trials. The same can be said for σ values which also show the same curve shape as the ternary, albeit a<br />
93