- Page 1 and 2:
Exploration and Optimization of Tel
- Page 3 and 4:
Abstract Thermoelectric materials a
- Page 5 and 6:
Acknowledgements To begin, I would
- Page 7 and 8:
Table of Contents List of Figures..
- Page 9 and 10:
9.3.1. Heating, XRD, and Structural
- Page 11 and 12:
List of Figures Figure 1.1 (a) Pelt
- Page 13 and 14:
Figure 9.2 Selected DOS calculation
- Page 15 and 16:
List of Equations Equation 1.1 Dime
- Page 17 and 18:
Table B.1 Atomic positions, isotrop
- Page 19 and 20:
Section I: Fundamentals Background
- Page 21 and 22:
Opposing the Peltier Effect is the
- Page 23 and 24:
Hence it follows that a good thermo
- Page 25 and 26:
a b ∗ Equation 1.4 (a) Ele
- Page 27 and 28: Historically, thermoelectric materi
- Page 29 and 30: 1.3.2. Advantages and Disadvantages
- Page 31 and 32: common stoichiometry studied with c
- Page 33 and 34: Figure 1.8 (a) Ge Quantum Dots [74]
- Page 35 and 36: Chapter 2. Background of the Solid
- Page 37 and 38: 2.2. Defects, Non‐Stoichiometry a
- Page 39 and 40: electric field draws electrons towa
- Page 41 and 42: ∑ known as a Bloch function, w
- Page 43 and 44: orbital Hamilton population [96] i
- Page 45 and 46: 2.5.1. Doping and Substitution: Tun
- Page 47 and 48: The major problem with exclusively
- Page 49 and 50: Chapter 3. Synthesis Techniques All
- Page 51 and 52: Since reactions are driven by both
- Page 53 and 54: Table 3.1 Commonly used fluxes. [12
- Page 55 and 56: The procedure is carried‐out on a
- Page 57 and 58: Chapter 4. X‐Ray Diffraction Anal
- Page 59 and 60: The closely related electron densit
- Page 61 and 62: The majority of samples emerge from
- Page 63 and 64: int ∑ mean ∑ | | Equat
- Page 65 and 66: 4.3.1. Rietveld Method In 1967, Hug
- Page 67 and 68: Chapter 5. Physical Property Measur
- Page 69 and 70: The electrical conductivity, σ, is
- Page 71 and 72: a p b 0.1388 53 c Equati
- Page 73 and 74: measurement implies that there was
- Page 75 and 76: Figure 5.6 Home‐made electrical c
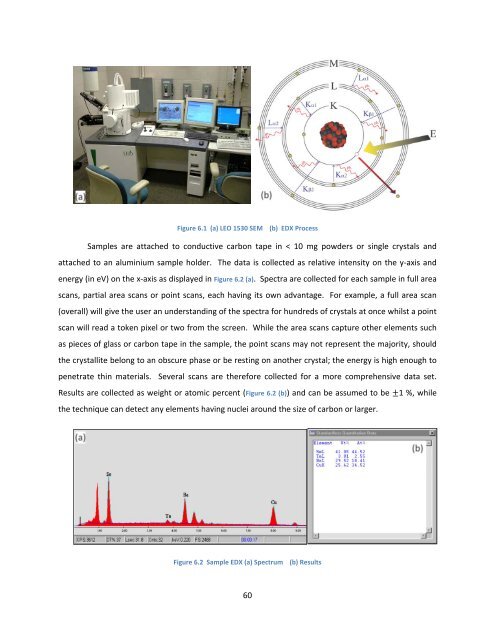
- Page 77: The SEM is constructed from an elec
- Page 81 and 82: 2 4 ext Equation 6.2 Ma
- Page 83 and 84: Section III - Layered Bi2Te3 Compou
- Page 85 and 86: aforementioned studies address the
- Page 87 and 88: Pb‐based compound (~‐60 V∙K
- Page 89 and 90: also differ in 2 there, while the r
- Page 91 and 92: Table 7.2 LeBail data for phase‐p
- Page 93 and 94: The physical properties, as mention
- Page 95 and 96: Upon examination of the power facto
- Page 97 and 98: Sn2Bi2Te5 was eventually found pure
- Page 99 and 100: From the understanding of this comp
- Page 101 and 102: Table 8.1 Rietveld refinements on S
- Page 103 and 104: Although there is evidence here of
- Page 105 and 106: Figure 8.3 DOS calculation comparis
- Page 107 and 108: In order to better determine if the
- Page 109 and 110: 8.3.3. Physical Property Measuremen
- Page 111 and 112: Figure 8.7 Thermal conductivity (le
- Page 113 and 114: the thermal conductivity slope that
- Page 115 and 116: 8.4. Conclusions and Future Work A
- Page 117 and 118: in Chapter 3 (except Arc Melting) w
- Page 119 and 120: Table 9.2 LeBail refinements on var
- Page 121 and 122: 9.2.3.1. Doping Trials: [Tr]xSn1‐
- Page 123 and 124: 9.2.3.2. Substitution Trials: [Tr]x
- Page 125 and 126: One can observe a variety of grain
- Page 127 and 128: 9.2.5. Conclusions Drawn from SnBi4
- Page 129 and 130:
SnBi4Te7, but suggest similar albei
- Page 131 and 132:
9.4. Project Summary and Future Wor
- Page 133 and 134:
Chapter 10. Introduction to Tl5Te3
- Page 135 and 136:
Figure 10.2 DOS calculations for Tl
- Page 137 and 138:
Thallium‐based chalcogenides clea
- Page 139 and 140:
: 36.3 (expected: 48.8 : 13.8 : 37.
- Page 141 and 142:
sintering of these pellets. A cold
- Page 143 and 144:
Figure 11.2 Thermoelectric properti
- Page 145 and 146:
at 319 K, increasing smoothly to 0.
- Page 147 and 148:
purity upon the first heating with
- Page 149 and 150:
Tl/Sn/Bi present in the 4c Wyckoff
- Page 151 and 152:
V∙K ‐1 at 592 K. As the bismuth
- Page 153 and 154:
Electrical conductivity values are
- Page 155 and 156:
Chapter 13. Modifications of Tl9SbT
- Page 157 and 158:
Table 13.1 Rietveld refinements for
- Page 159 and 160:
make an observable trend despite th
- Page 161 and 162:
The electrical conductivity values
- Page 163 and 164:
Section V - Ba Late‐Transition‐
- Page 165 and 166:
Obviously, compounds possessing the
- Page 167 and 168:
Table 14.1 Known Ba‐Cg‐Q compou
- Page 169 and 170:
All samples were analyzed by means
- Page 171 and 172:
crystal structure study of the Se
- Page 173 and 174:
As emphasized in Figure 15.2 (b), t
- Page 175 and 176:
The Cu-Cu COHP curve, cumulated ove
- Page 177 and 178:
Chapter 16. Ba3Cu17‐x(S,Te)11 and
- Page 179 and 180:
the selenide‐telluride before, th
- Page 181 and 182:
surrounded by three Q1 atoms. Besid
- Page 183 and 184:
Figure 16.3 The three‐dimensional
- Page 185 and 186:
Figure 16.5 Seebeck coefficient (le
- Page 187 and 188:
Chapter 17. Ba2Cu7‐xTe6 17.1. Int
- Page 189 and 190:
Table 17.1 Crystallographic Data fo
- Page 191 and 192:
Table 17.2 Atomic coordinates, Ueq
- Page 193 and 194:
17.3.2. Electronic Structure Calcul
- Page 195 and 196:
Figure 17.6 Crystal orbital Hamilto
- Page 197 and 198:
Section VI - Supplementary Informat
- Page 199 and 200:
[33] Rowe, D. M.; Kuznetsov, V. L.;
- Page 201 and 202:
[90] Albright, T. A.; Burdett, J. K
- Page 203 and 204:
[156] Cottenier, S., Density Functi
- Page 205 and 206:
[219] Toure, A. A.; Kra, G.; Eholie
- Page 207 and 208:
[294] Kanno, R.; Ohno, K.; Kawamoto
- Page 209 and 210:
Table A.3 Atomic positions and Ueq
- Page 211 and 212:
Table B.2 Selected interatomic dist
- Page 213 and 214:
Table B.5 Atomic coordinates and Ue
- Page 215 and 216:
Table B.7 Selected interatomic dist